A memory leak is caused when a memory allocation is not cleared when it is not needed. You can think of it as a large number of state or variables that are still holding data even when they are not being used. It is not a bug that most functional tests could catch as the functionality would be running fine. This leak can be caught by CPU Usage in chrome dev tools or your system monitor.
I ran into this problem recently and spent days figuring it out through chrome dev tools. Here, I will tell you of one of the simple ways to catch them, fix them and notice the change.
Before jumping into dev tools, let’s see some of the most common mistakes that lead to memory leakage. To find the source of it, you can clear out the code in the file that is causing the leak, then put it back one by one to see what is causing the issue.
1. Not unsubscribing to observables.
Example of a wrong observable:
this.loadingData$ = this.store.pipe(select(getDataIsLoading)).subscribe();
Correct Usage:
this.loadingData$ = this.store.pipe(select(getDataIsLoading), takeUntil(this.ngUnsubscribe$)).subscribe();
This is one of the most common mistake developers make while using RxJs. You should make sure that if you are using an observable, you should either unsubscribe to it or use it one time if that matches your use-case. Take(1) is a very important concept. I dealt with a memory leak that was 70% the fault of using takeUntil() where it should have been take(1).
Example for take(1):
this.store.pipe(select(getData), take(1)).subscribe((data) => {
      this.data = data;
});
Example for takeUntil():
this.store.pipe(select(getData), takeUntil(this.ngUnsubscribe$)).subscribe(() => {
      this.newData(true);
});
And this ngUnsubscribe would be completed in ngOnDestroy.
ngOnDestroy() {
    this.ngUnsubscribe$.next();
    this.ngUnsubscribe$.complete();
 }
If like me, you are working on a component that constantly fetches new data, is not destroyed and has components, it is likely you have observables which are being initiated within the takeUntil() of another observable.
Say you have a observable listening for data, as soon as it arrives you want to compute something based on another observable, in that case, the inner observable should be destroyed first and then recreated like
this.dataChangedUnsubscribe$.next(true);
this.dataChangedUnsubscribe$.complete();
this.dataChangedUnsubscribe$ = new Subject<boolean>();
2. Creating a large number of objects or closures that are not properly cleaned up.
Within an observable, make sure to clean up objects and variables and on ngOnDestroy as well. This helps in cleaning up the detached DOM elements. Keeping large amounts of data in memory for extended periods of time also results in memory leakage.
3. Registering event listeners or timers that are not properly removed.
Another thing that is often overlooked is clearing timeouts.
@HostListener('paste', ['$event']) blockPaste(event: KeyboardEvent) {
    setTimeout(() => {
        this.value = event.srcElement['value'];
        event.preventDefault();
     }, 120);
  }
In Angular, you typically do not need to manually unsubscribe from @HostListener event handlers to prevent memory leaks. Angular manages the lifecycle of these event listeners for you, but if you have a complex flow of code and or if you’re manually adding listeners to the DOM, it is good practice to clean up the listeners.
This could be changed to:
@HostListener('paste', ['$event']) blockPaste(event: KeyboardEvent) {
    this.blockPasteListener = setTimeout(() => {
      this.value = event.srcElement['value'];
      event.preventDefault();
    }, 120);
  }
And the ngOndestroy should look something like this:
ngOnDestroy() {
    window.removeEventListener('scroll', this.scrollEvent,  true);
    clearTimeout(this.blockPasteListener);
    document.removeEventListener('paste', this.blockPaste);
  }
}
Same goes for any mouse or keyboard listeners.
this.renderer.listen(div, 'mousedown', (e) => {...}
This should be changed to:
private mouseDownListener: () => void;
//rest of the code
this.mouseDownListener = this.renderer.listen(div, 'mousedown', (e) => {...}
//rest of the code
ngOnDestroy() {
    this.ngUnsubscribe$.next(true);
    this.ngUnsubscribe$.complete();
    document.removeEventListener('mousemove', this.onMouseMove); //if used
    this.mouseDownListener();
  }
These were some of the common mistakes in the code that result in memory leaks. Lets take a look at chrome dev tools now.
Catching and verifying memory leaks through chrome dev tools:
- On chrome, right click on the screen and open the inspector
- Go to more options -> more tools
- Select performance monitor
Performance monitor:
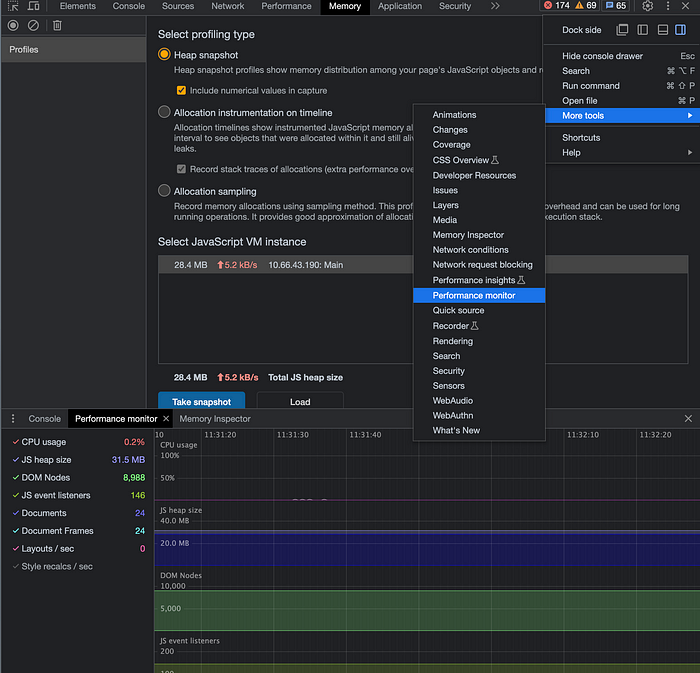
The performance monitor will show a graph displaying any jumps in the memory, CPU Usage, JS heap size etc. Take note of the graph and numbers than go to the component where you think the leak is. Change components or if you have a list of items, click on different items and observe if the graph shows a large difference. If the heap size is large and not reducing once you go back to the starting point, AND not reducing when you click on the garbage collector as shown below, you have a memory leak.
Chrome has a garbage collector that runs after every few minutes. You can run it manually from here. If the memory size is significantly larger than before even after running the garbage collector, than there is a leak.
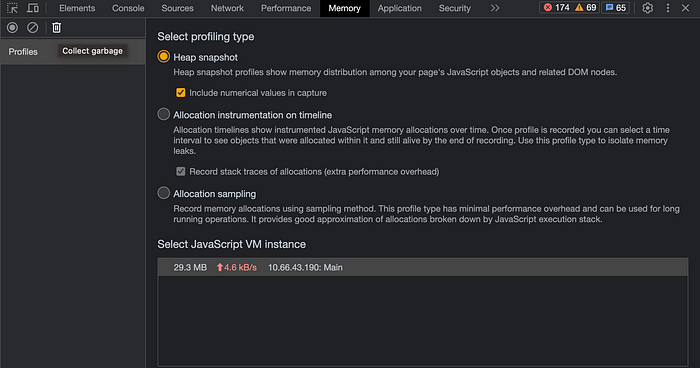
You can also figure out which objects are being retained through heap snapshots. In the memory tab, take a heap snapshot before clicking on the component that is causing trouble.
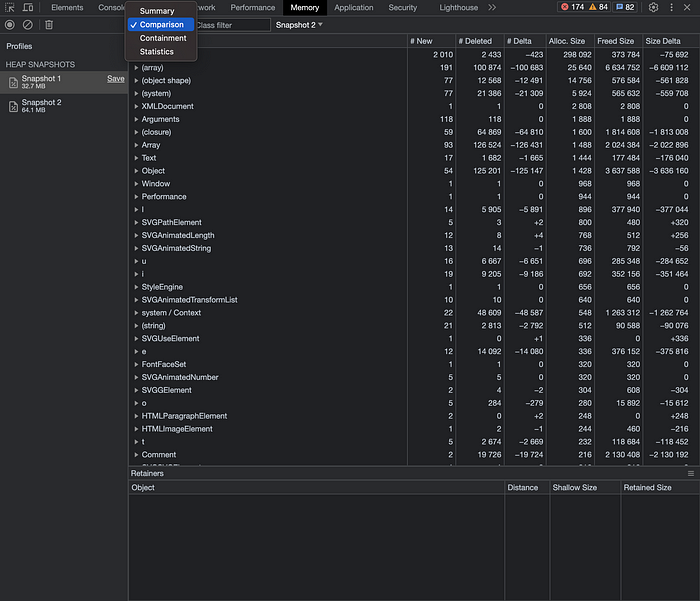
Then take another heap snapshot after clicking on the component. Then click on comparison and compare the two snap shots to see which new objects are added.
You can then take another heap snapshot after going back to the starting point to see which objects are being retained.
That’s it!
The best practice for fixing these leaks, especially if you’re a beginner, is to go over the code one by one and see which line of code is causing the issue. That way your Angular concepts would be put to use and you can verify if the leak is fixed through the dev tools.
Thank you for reading and good luck! Memory leaks are tedious to resolve but once you do fix them, it feels like you climbed Mount Everest.
Comments
Loading comments…