Turning climbing strength metrics into grade predictions using scikit-learn, FastAPI, React, and Databricks MLflow. Deployed with Docker + Railway
The Challenge: Can We Predict Climbing Performance from Strength Metrics?
As a climber and data scientist, I noticed something interesting: climbers obsess over strength metrics like maximum number of pullups, weighted hangs and weighted pullups, finger strength and endurance, but struggle to understand how these translate to actual climbing grades.
There’s already a few companies and platforms out there that allow you to fill in your strength metrics, or complete custom test, and then provide you with what your median climbing grades should be. I thought it would be fun to see if I could build a system that also does that — predicting bouldering and sport climbing performance from measurable strength data.
I had a relatively decent starting point:
- 1,200 rows worth of climbers data
- 12+ features (pullup strength, finger endurance, years climbing)
- A hypothesis: strength metrics should correlate with grades
The challenge wasn’t just building a machine learning model, but more about creating something that is production-grade and that would continue to improve over time. The ideal model should:
- Predict bouldering & sport grades from strength data
- Provide explainable predictions (which strength features matter most)
- Compare users to climbers with similar strength
- Continuously improve from user feedback
- Deploy reliably to the cloud
- Present insights through an intuitive web interface, with not a whole lot of technical jargon
Training the models is the easy part. The main challenge for me was going to be learning how to expose the model to users in a production environment, provide relatively accurate results, be able to gracefully handle real-world messy data (and user errors), and make sure it’s continuously improving.
This article is my way of documenting how I went about building the grade prediction system that goes beyond the model, featuring automated retraining pipelines, model promotion gates, production monitoring, and full CI/CD. It’s the kind of infrastructure you need in the real world, where models need to evolve without manual intervention.
The app predicts both bouldering performance sport climbing grades separately based on features which I identified as most valuable to the models: body weight, maximum pullups, maximum weighted hangs on a 20mm edge, weighted pullup strength, continuous hang time and repeater hang endurance on a 20mm edge, and years of climbing experience. Users then get both a grade prediction and a visual analysis showing where they sit compared to cohorts at each grade level, plus some info on how each feature played a role in their predicted grades.
How It Works: The User Journey
Before diving into the technical architecture, let’s walk through what actually happens when someone uses the system:
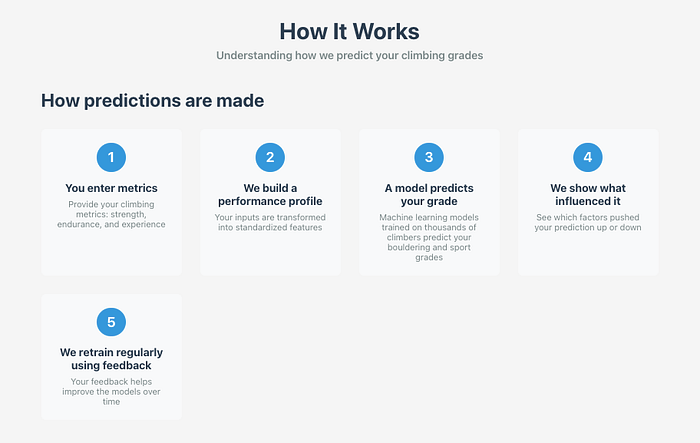
The flow of information through the system
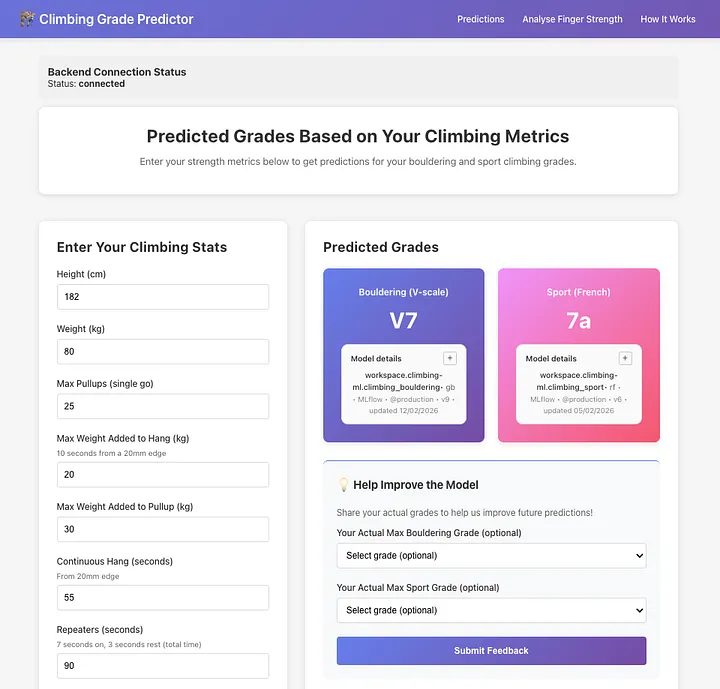
1. You input your strength metrics
Open the web app and enter your stats: how many pullups you can do, how much extra weight can you add to a single pullup, how much weight you can add to your 20mm edge hang, how long you can hold a 20mm edge, how long you can do 7s:3s repeaters for, again on a 20mm edge, and finally how many years you’ve been climbing.
2. The system predicts your climbing grade
Behind the scenes, your data flows from the React frontend to a FastAPI backend. The backend fetches the current production model from Databricks MLflow (a model registry that tracks versions and performance). The model analyses your metrics and predicts both your bouldering grade (V0-V16) and sport climbing grade (4c-9a+).
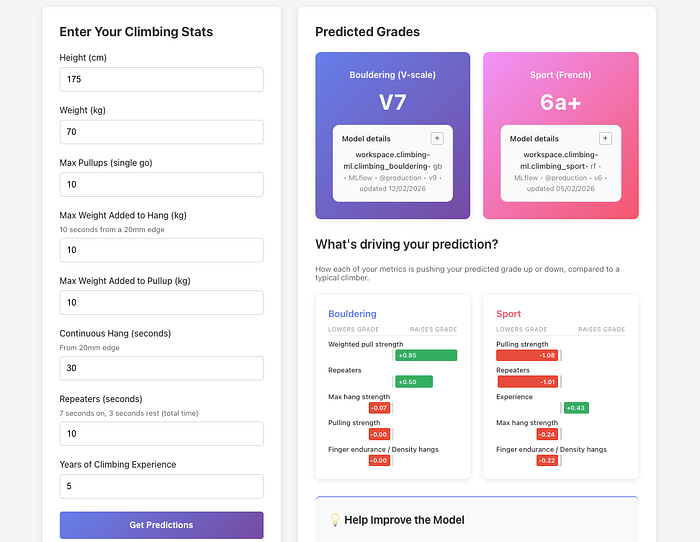
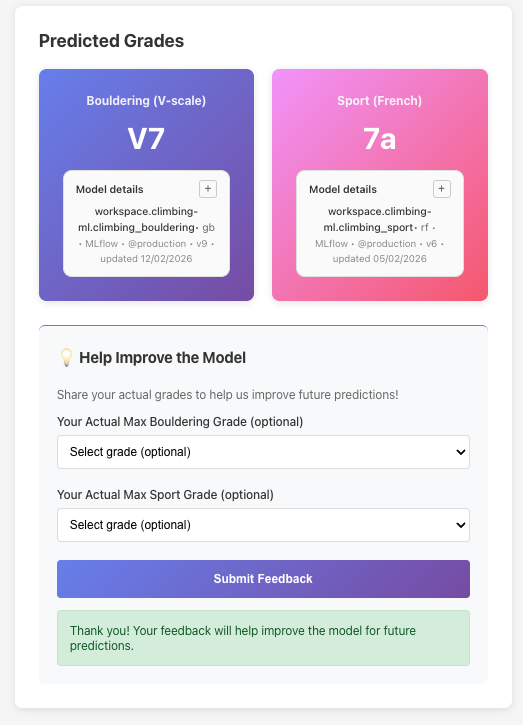
The results a user sees after entering their stats and clicking ‘get predictions’
3. You get personalised insights
The app doesn’t just give you a number. It shows you which of your strengths are helping you most (“Your finger strength is pushing your grade up”) and which might be holding you back (“Your endurance could use work”). It also compares you to climbers with similar strength profiles so you can see if you’re over or underperforming relative to your physical capabilities.
4. Your feedback makes the system smarter
After using the predictor, you can report your actual sport and bouldering grades and submit it as feedback. This feedback then gets stored in a MongoDB database and every week, an automated system wakes up, pulls all the new feedback, retrains the models, and if the new models are better, it automatically deploys them. In theory, this means that as more users provide feedback, the models will improve, and predictions will get better.
That’s the entire loop: predict, explain, collect feedback, improve, repeat. All of it happens automatically, without anyone manually updating models or pushing code.
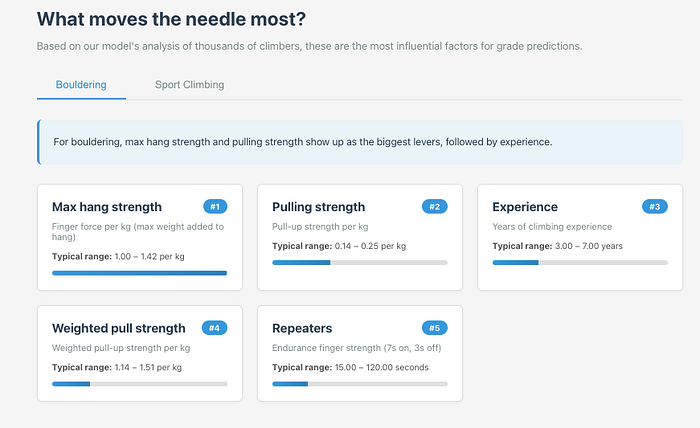
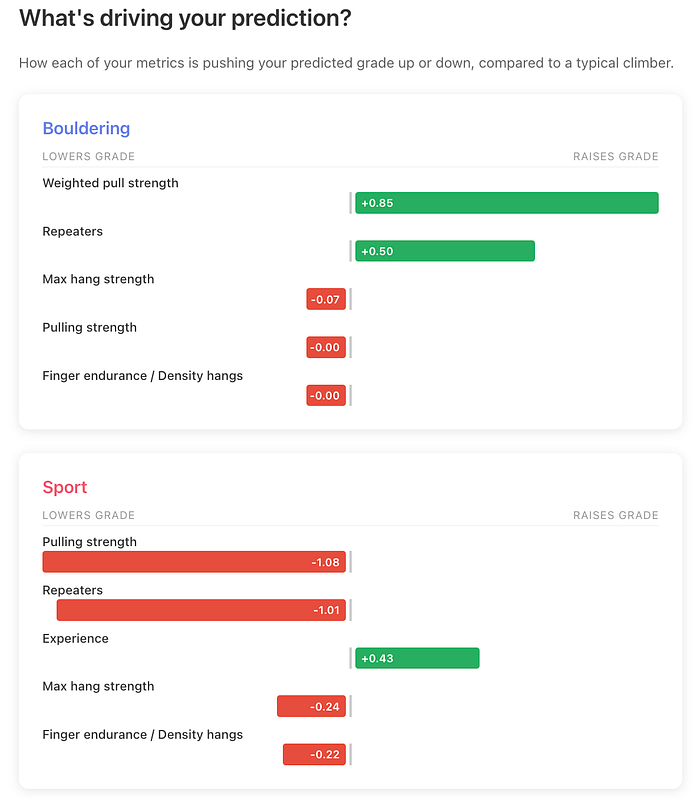
The user can see also see how important each feature is to the model, including the typical ranges for each one.
Tech Stack: Production-First Choices
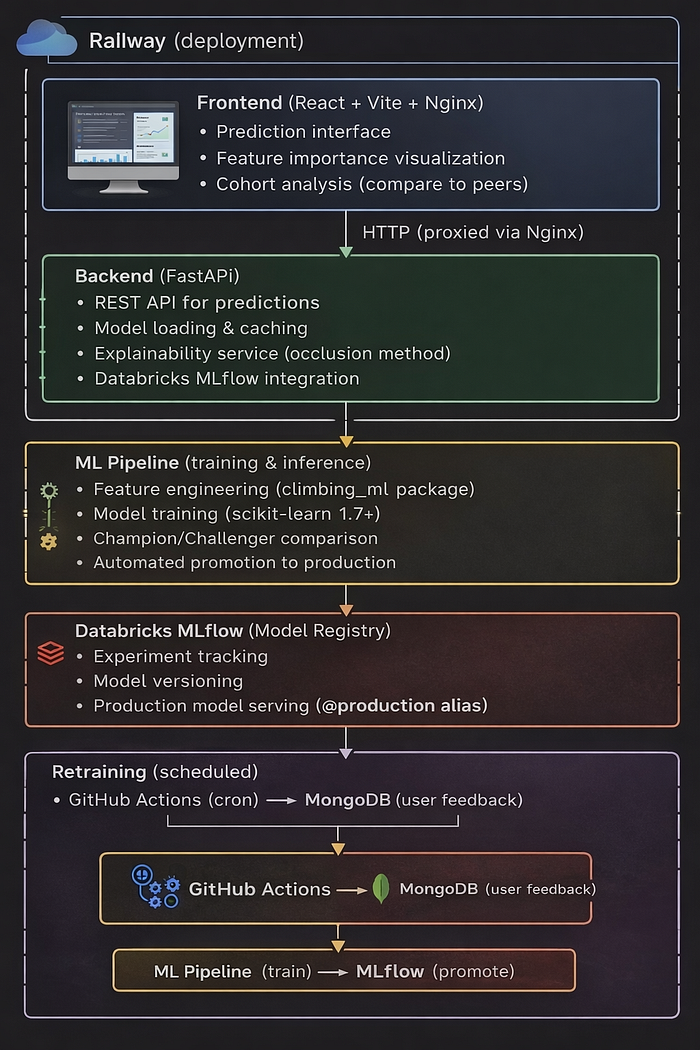
End to end tech stack including how the data flows between platforms
The application architecture reflects real-world ML system requirements:
- FastAPI backend serving predictions via REST API, with automatic schema validation and interactive documentation
- React frontend (Vite) with interactive Recharts visualisations for grade distributions and feature analysis
- Databricks MLflow (Unity Catalog) for model registry, versioning, lineage tracking, and production alias management
- MongoDB for collecting user feedback on actual vs. predicted grades, feeding the continuous learning loop
- Github (+ Github Actions) for triggering model retraining and version control
- Railway deployment running backend and frontend as separate services with automatic HTTPS and custom domains
System Architecture: End-to-End Data Flow
The system has two primary data flows:
Prediction flow:
- User inputs stats in React frontend (deployed on Railway)
- Frontend calls FastAPI backend (Railway) via REST API
- Backend loads models from Databricks MLflow using @production alias
- Returns predictions with feature explainability and cohort analysis
Training flow:
- GitHub Actions triggers nightly retraining job
- Docker container fetches user feedback from MongoDB
- Trains six candidate models, evaluates by RMSE
- Promotion gate compares against current production models
- Registers promoted models to MLflow Unity Catalog
- Backend cache refresh picks up new models automatically
This creates a complete continuous learning loop: user feedback improves models, better models improve predictions, better predictions encourage more feedback.
Engineering Decisions That Matter
Several architectural choices which I made throughout this project:
- MLflow over pickle files: Model versioning, lineage tracking, rollback capability, and audit trails. Essential for production systems where you need to know exactly which model served which prediction.
- Promotion gate: Prevents model degradation. New models must prove they’re better before reaching production. This is critical when you have automated deployments.
- Algorithm-agnostic pipeline: Training all three algorithms and comparing them removes the need to pick one upfront. If data distribution shifts, the best algorithm might change.
- Relative API URLs: The same frontend build works locally (localhost:8000) and in production (api.domain.com) by using relative paths. Simplifies deployment.
- Per-user explainability: Each prediction shows which features mattered most for that specific user. Not just global feature importance but personalised insights.
- Full CI/CD testing: Backend smoke tests on every push, deployment smoke tests against live Railway URLs, and retraining verification steps ensure nothing breaks silently.
Results: Production Performance
The system achieves strong predictive performance across both disciplines. Bouldering models consistently hit R² values of 0.7–0.8, meaning they explain 70–80% of grade variance from the input features. Sport climbing is a harder prediction problem as labels are noisier, grade distributions are wider, and route style matters more , but models still achieve R² of 0.5–0.7.
The Models: Algorithm Selection by Performance
Rather than picking a single algorithm upfront, the system trains three candidates for each discipline: Gradient Boosting, Random Forest, and Ridge Regression. That’s six models total per training run. The pipeline evaluates all six and selects the best performer for each discipline based on RMSE.
Every model training run logs to Databricks MLflow:
- Hyperparameters (learning rate, tree depth, etc.)
- Metrics (RMSE, MAE, R²)
- Feature importance
- Training data hash (for reproducibility)
Models only reach production if they beat the current champion by ≥1% on RMSE. This approach removes human bias from model selection, and pretty much allows us to be flexible in terms of which model is being used. If for example we get enough feedback that means Random Forest starts outperforming Gradient Boosting, the system adapts automatically, and the best performing model is served via the frontend.
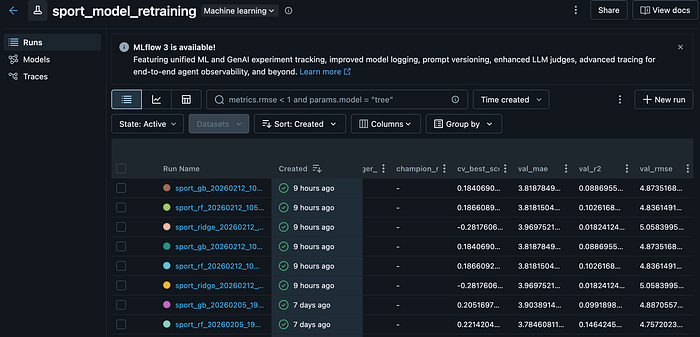
What the model retraining looks like within Databricks ML Flow
Understanding the Evaluation Metrics
(All metrics are computed on predicted vs. actual climbing grades during model evaluation)
Choosing the right metrics is critical for evaluating the models, and it’s easy to get caught up in fine-tuning parameters to eek out tiny improvements. I decided to focus on three complementary metrics during training and model selection, which work by comparing the model predicted grades against the actual grades climbers reported.
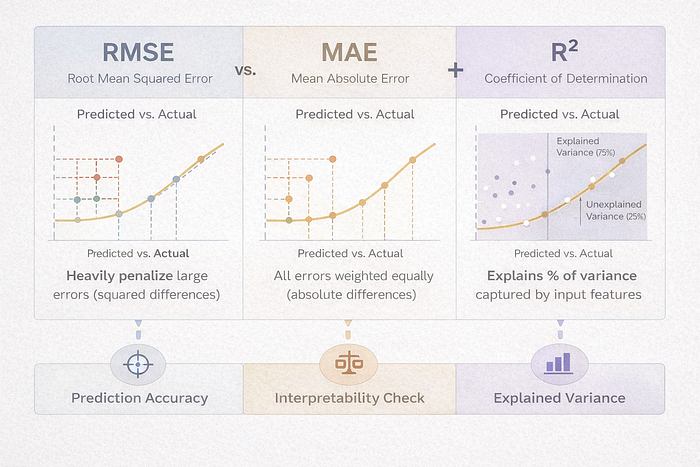
How the Three Metrics Work Together
Think of them as answering three different questions about predicted vs. actual grades:
- RMSE → “How bad are our worst misses?”
- MAE → “On average, how many grades off are we?”
- R² → “How much of performance differences can we explain?”
RMSE (Root Mean Squared Error) — The primary decision metric
This measures the average size of the differences between predicted grades and actual grades, with larger errors penalised more heavily (the difference is squared). RMSE is also the metric I used as the promotion criterion because in production, large mistakes matter more than small ones. RMSE strongly penalises big prediction gaps, which makes it the safest metric to optimise for when serving real users.
MAE (Mean Absolute Error) — Interpretability check
MAE measures the average absolute difference between predicted and actual grades. Unlike RMSE, it treats all errors equally so a 4-grade miss counts exactly four times as much as a 1-grade miss, with no extra penalty because of squaring. I track MAE alongside RMSE to ensure the model isn’t just optimising for a few extreme cases, for example if RMSE drops but MAE stays flat, the model might be overfitting outliers.
R² (Coefficient of Determination) — Explained variance
R² tells us much of the variation in actual climbing grades is explained by the model’s predictions. An R² of 0.75 means the model explains 75% of why climbers perform at different levels based on their strength metrics. This helps communicate model quality to non-technical users, so for example the R² of 0.75 means “The model captures about 75% of the reasons that determine your grade, but there’s 25% which we can’t determine based on the data we have.”
R² on its own can be misleading, which is why I paired it with RMSE and MAE. A model with high R² might still make large individual errors which we wouldn’t necessarily be able to see. So what we’re doing here is using R² for context, and allowing RMSE to measure prediction accuracy and which model gets used.
The Data Challenge
Collecting climbing data is hard:
- Initial dataset: ~1,200 climbers (scraped forums, surveys, datasets from PowerCompany Climbing)
- Features: Self-reported strength metrics (12+ features)
- Labels: Self-reported best grades
Data quality issues:
- Measurement inconsistencies (different hang edges, measurement protocols, grading systems, metric vs imperial system)
- Most of the fields were free-text, so there were plenty of typos and inconsistencies
- Ego bias (climbers overestimate their grades)
- Small sample size for elite climbers (V12+, 8a+)
Solution: Gather fresh data from users each time they use the website. Continuous learning pipeline with fixed fields and standardised formats. Every user who submits feedback becomes a new training example and the model improves over time as more data arrives.
This part of the project was important to me, as I wanted to make sure I could take the models beyond a simple notebook and pkl file, and transform it into production-grade infrastructure. The goal was to reduce all manual intervention to retrain and deploy models, and automate as much of the process as possible:
- Scheduled execution: GitHub Actions triggers every week
- Containerised training: Builds a Docker container with dependencies, fetches latest user feedback from MongoDB
- Algorithm tournament: Trains six models (3 algorithms × 2 disciplines), compares all candidates by RMSE
- Promotion gate: Critical safety mechanism which only promotes to production if the new model shows >1% improvement OR >0.05 absolute RMSE improvement over the current production model
- Model registration: Promoted models are registered to Databricks MLflow Unity Catalog with the @production alias
- Automatic serving: Backend picks up new models via cache refresh, no redeployment needed
The promotion gate is the most important piece. It prevents model regression, so that a new model that performs worse than the current production model never reaches users. This is essential for production systems where model quality directly impacts user experience.
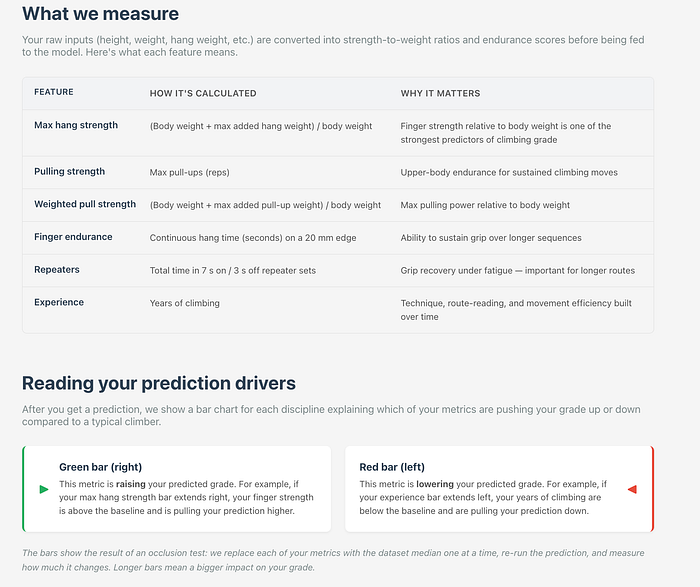
Explainability: Not Just Black Box Predictions
Users don’t want a number. They want to know why. I implemented two explainability features:
Local Feature Drivers
For each prediction, I measure how much each feature “pushed” the grade up or down:
This shows users: “Your max hang is pushing your grade up by 0.8 V-grades, but your endurance is holding you back by 0.5 V-grades.”
Cohort Analysis: Compare to Peers
Built a feature that finds climbers with similar finger strength (±8th percentile) and shows:
- What grades do they typically climb? (25th-75th percentile range)
- Where do you sit in this cohort?
- Are you over/underperforming relative to your strength?
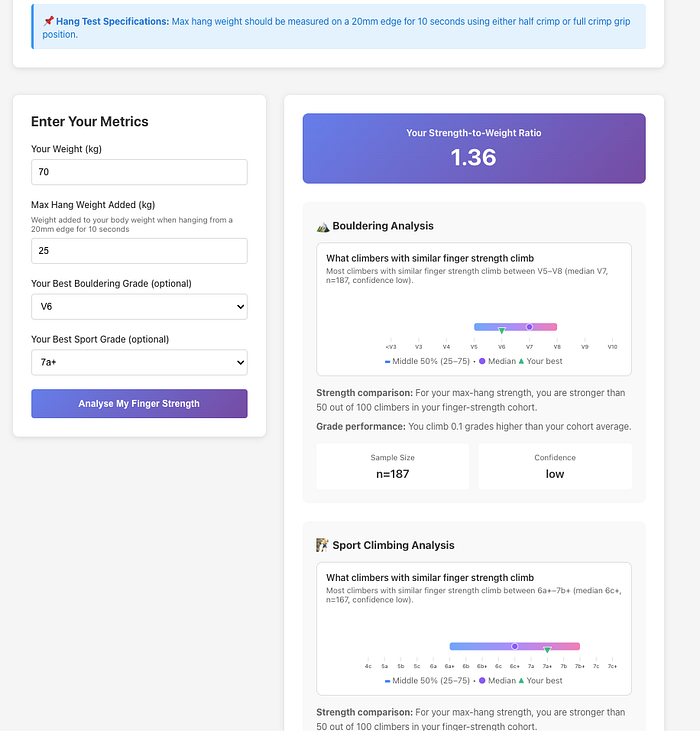
This creates actionable insights: “You have strong fingers for your weight, but you’re climbing below what similar climbers achieve. Focus on technique.”
Final Thoughts
Predicting human performance from 6 features is hard. Of course, climbing abilities vary beyond simple strength metrics, and this tool shouldn’t be relied on a single source of truth for climbers, but it can provide some useful insights into areas of weakness or strengths.
I also confirmed the fact that building ML systems for production is fundamentally different from training models in notebooks. It requires thinking about versioning, monitoring, automated testing, deployment pipelines, rollback strategies, and continuous improvement loops. The model is just one component in a larger system.
This climbing grade predictor demonstrates those principles: automated retraining with promotion gates, model registry integration for versioning and rollback, CI/CD testing throughout the pipeline, and continuous learning from user feedback. It’s the kind of infrastructure you’d need to maintain dozens or hundreds of models in production.
Try It Yourself
Since the first iteration of this project, over 1,300 climbers have interacted with the model and provided me with their feedback, which has helped me continue working on this, improving it as more data comes in, and keeping me motivated to keep learning from it.
Want to see how your strength metrics stack up? Try the predictor and get insights on where to focus your training.
Live Page: https://machine-learning-climbing-predictions.up.railway.app/
GitHub: https://github.com/Tetleysteabags/climbing-grade-predictions
*Built with Python, FastAPI, React, Docker, and Databricks MLflow. Deployed on Railway. Full code available on GitHub.*
Comments
Loading comments…