A single cooling fault can appear in three separate tools: a temperature alarm in the building management system, throttled servers in the IT monitoring tool, and, some time later, a service desk ticket. Connecting those records to a common cause is the integration challenge this article explores.
Data center teams increasingly need live telemetry across multiple systems and distributed environments. Reporting requirements add another reason to bring operational data together. In the EU, data centers with an installed IT power demand of at least 500 kW have reporting duties, subject to applicable exemptions. These requirements cover energy, water, and ICT-capacity indicators.
Unified data center operations software brings data from power, cooling, environmental, IT, network, and security systems into one operational model. It retains their history and routes alarms through a shared event pipeline into an incident workflow. Local controllers retain control responsibility, while life-safety actions remain with the certified systems responsible for them.
That definition leads to the central design question: which layers should be shared, and which should remain separate?
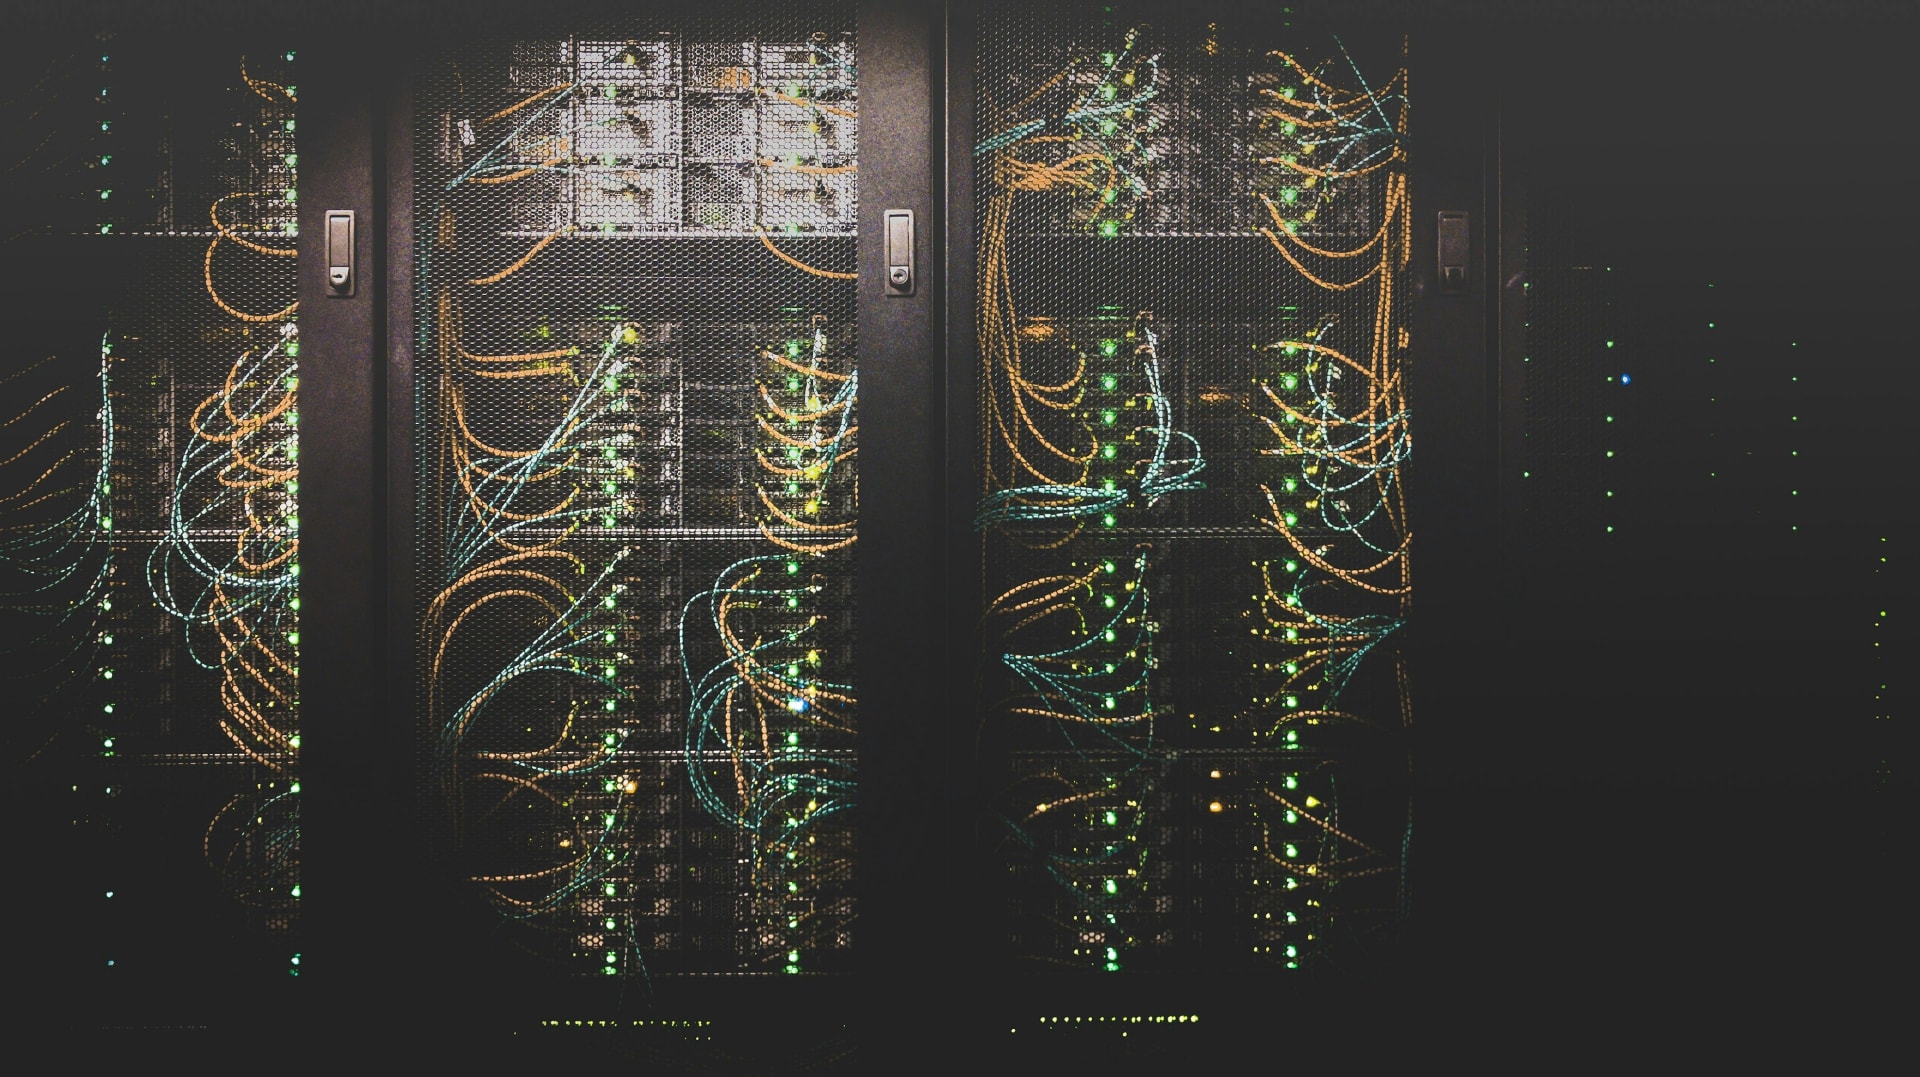
DCIM, BMS, and IT Monitoring: Overlapping Responsibilities
Data center infrastructure management (DCIM) software collects and manages information about IT and facility assets, resource use, and operational status. Its capabilities vary: some products emphasize monitoring and planning, while others provide deeper equipment integration, analytics, and control. Each product and licensed module therefore needs to be evaluated individually.
Other system classes overlap with DCIM and with one another. A building management system (BMS), also called a building automation system (BAS), monitors and controls building services such as cooling and ventilation. An electrical power monitoring system (EPMS) focuses on the power chain.
IT and network monitoring tools track servers, storage, connectivity, performance, and faults. An IT service management (ITSM) tool typically holds incident tickets, change records, and problem records. Deciding where these records belong—and how other systems update them—is an early project decision.
Standards such as EN 50600-3-1 describe data center management and operational processes rather than assigning every responsibility to a particular software category. Product labels alone cannot establish the integration boundary.
Rule of thumb: map responsibilities by function, then determine which system owns each function.
What the Layer Has to Connect
On the power side, the layer may connect utility feeds, generators, switchgear, protection relays, meters, uninterruptible power supply (UPS) units, and floor and rack power distribution units (PDUs).
On the cooling side, it may connect chillers, computer room air conditioners and air handlers (CRAC and CRAH units), in-row units, liquid-cooling distribution units (CDUs), and temperature, humidity, and leak sensors.
The scope can also include servers, switches, storage, access control, intrusion detection, CCTV, and fire alarm panels.
A protocol list is a useful starting point, but it does not define the integration. MQTT transports messages without prescribing the meaning of their payloads. Modbus register mappings depend on the device vendor. Supporting the same protocol does not mean two systems agree on what a value represents.
The integration review should verify each interface’s security mode, authentication, and encryption settings. SNMP supports different security levels, including modes without authentication or encryption. OPC UA and MQTT also require appropriate security configuration. BACnet/SC provides a secure transport, but its availability must be checked for the equipment involved.
The following table provides a checklist for the points list: the per-device inventory of every value an integration reads or writes.
| Domain | Equipment | Interfaces to verify | Check before sign-off |
|---|---|---|---|
| Power chain | Switchgear, relays, meters, UPS units, PDUs | Modbus TCP/RTU, SNMP, BACnet/IP, IEC 61850 | Register maps, units, scaling, and security settings |
| Cooling and environment | Chillers, CRAC/CRAH units, in-row units, CDUs, sensors | BACnet/IP or MS/TP, Modbus, SNMP | Secure transport availability and writable points |
| IT and network | Servers, switches, storage | Redfish, IPMI, SNMP, streaming telemetry | Firmware and schema versions, credentials |
| Physical security | Access control units, readers, cameras | OSDP, applicable ONVIF profiles, and the access system’s event interface | Supported features, profile conformance, and command ownership |
| Fire | Fire alarm control panels | Documented panel interface, where available | Event-only scope, connected-system integrity, and local approvals |
These interfaces serve different purposes. IEC 61850 supports communication with intelligent electronic devices in power automation. Redfish provides standardized management interfaces for IT infrastructure. OSDP connects access control units with peripheral devices, rather than providing a universal interface to the entire access-control application.
Legacy interfaces also need attention. No further IPMI specification updates are planned, although existing implementations remain in use. An integration assessment should identify the capabilities and limitations of each deployed interface.
A Reference Architecture in Five Layers
A practical architecture separates equipment connections from the shared operational model and the applications that consume it. Facility, IT, security, and fire systems connect through edge adapters and explicitly authorized communication paths.
The supervisory layer contains the normalized model, event pipeline, and historian. Any permitted commands follow separate, audited paths to the relevant controllers. In this reference design, fire and physical security integrations provide events only.
1. Edge Adapters
An adapter near the equipment communicates through the field protocol, applies the points list, and buffers data when the upstream connection fails.
Buffer capacity, persistence after a restart, and behavior when storage fills are design decisions that need testing. Support for a protocol alone does not guarantee reliable offline operation.
When buffered data is replayed, consumers must be able to distinguish it from current telemetry. Sparkplug, for example, provides an is_historical flag for values that should not be treated as current, real-time readings.
2. A Normalized Model
Every point is mapped to an asset, location, unit, and quality state. This allows teams to interpret equipment data consistently across sites.
A temperature reading, for example, should identify the sensor, its location, its unit, and whether the reading is valid or stale. Without these details, a dashboard can display a number while leaving its operational meaning unclear.
Public models such as Project Haystack and Brick can help establish consistent names and relationships. They provide useful vocabulary, but the operational model still needs an owner responsible for mappings, exceptions, and maintenance.
3. An Event Pipeline with Explicit Alarm States
Events need an identity, source, severity, and two timestamps: when the event occurred and when it was received. Keeping both timestamps helps distinguish equipment behavior from communication delays.
Alarm acknowledgment and alarm activity must also remain separate. An operator may acknowledge a high-temperature alarm while the temperature remains above its threshold.
Acknowledging an alarm does not mean it has cleared.
Deduplication needs a documented identity rule defining which fields make two records the same event. Correlation groups related events, but it does not prove a root cause.
An illustrative event record might look like this:
{
  "event_uid": "site-a:bms:evt-a",
  "source": "site-a/hall-a/crah-a",
  "asset_ref": "asset:crah-a",
  "occurred_at": "<occurrence timestamp>",
  "received_at": "<receive timestamp>",
  "source_severity": "<source severity>",
  "condition_active": true,
  "acknowledged": false,
  "historical": false
}
The field names are specific to this example. The important concepts are a stable event identity, a clear asset reference, separate occurrence and receive times, and independent active and acknowledged states.
4. A Historian and an Alarm Record
A historian stores point values and events over time for trends, reports, and investigation. Alarm records also preserve the operational sequence: activation, acknowledgment, clearance, and other relevant state changes.
Alarm management standards such as ISA-18.2 and IEC 62682 provide useful lifecycle principles. These include identifying and rationalizing alarms, maintaining records, measuring performance, and managing changes.
Retention should match the operational purpose. Troubleshooting, energy reporting, and incident investigation may require different data resolutions and retention periods.
5. Consumers
Dashboards, shift reports, energy reports, northbound APIs, and ITSM integrations read from the shared model and historian.
Event delivery does not replace storage. Redfish event subscriptions, for example, do not provide a historical archive for clients that missed earlier events. Any workflow that requires history needs a durable receiving and storage path.
The incident workflow also needs explicit ownership. Decide which system creates the ticket, how it receives updates, and what happens when the source alarm clears.
Deployment: On-Premise, Cloud, Hybrid, and Edge
On-premise and air-gapped describe different properties. Software can run on customer premises while still having automated connections to external systems. An air-gapped environment requires those connections to be absent, with any transfers handled through controlled procedures.
Cloud deployment can support supervision and aggregation across sites, but it introduces dependencies on connectivity and service availability. These dependencies need to be assessed against the operational requirements of each site.
A hybrid architecture can keep equipment integration and essential local functions at the edge while placing fleet dashboards, reporting, and aggregation centrally. A temporary WAN outage should not prevent the site from performing the functions it must retain locally.
Edge autonomy needs to be demonstrated with the WAN disconnected. Testing should cover restarts, buffer limits, data replay, and the freshness information shown in the central view.
Multi-site estates also need a clear process for distributing configuration templates. Roll changes out in stages, beginning with a test site and a tested rollback procedure.
Whatever the deployment model, networks should remain segmented. NIST’s OT security guidance recommends isolating IT and OT devices and permitting only explicitly authorized communication between segments. IEC 62443 provides a related method based on zones and conduits.
Device management interfaces should not be exposed directly to the internet. Remote access should use controlled access paths, appropriate authentication, and authorization suited to the equipment and its operational risk.
When Not to Unify
“Unified” can refer to three separate decisions: sharing a data view, sharing a network, and sharing control authority. Each requires its own justification.
A common operational view can help teams understand an incident without merging the underlying networks or giving the central platform authority over every connected system.
Safety systems require particular care. Connecting fire detection and alarm systems to other software must preserve their integrity and comply with applicable requirements. Their certified functions should remain within the systems responsible for them.
Ownership and change procedures also differ. Control engineers may manage facility equipment, while IT teams manage servers and network services. A shared platform needs to respect those responsibilities and the testing required before operational changes.
Integration can also create commercial lock-in. Proprietary models, rules, and export formats may make a future migration expensive. Evaluating the exit path is therefore part of evaluating the platform.
A warning sign is a design in which one account or template change can issue commands to power or cooling equipment across many sites at once.
Separate read paths from write paths. Grant command rights by role, zone, and equipment class. Stage fleet-wide changes, and keep local interlocks and life-safety logic independent of the central layer.
An Evaluation Checklist
- Points list first. For each device, document the interface, firmware, security mode, units, scaling, writable points, and behavior when points are unsupported or stale.
- Alarm states. Confirm that active, acknowledged, and shelved states are separate. Shelving temporarily suppresses an alarm. Document the deduplication identity rule.
- WAN-loss test. Restart the edge node with the WAN disconnected, fill the buffer to its limit, and reconnect. Confirm that replayed data is marked as historical and that the central view shows the age of each value.
- Command authority. Confirm that every write is authorized by role and zone and leaves an audit record. In this reference design, fire and access-control commands remain in their own systems.
- Exit test. Export the model, history, and rules, and estimate the cost of moving them to another system.
One Platform Example: Iotellect
The vendor’s Iotellect DCIM software page describes a platform combining supervisory control and data acquisition (SCADA), BMS, and IT infrastructure management with physical security integration and incident management in one data model and engineering environment.
The page lists more than 50 protocols, including Modbus, BACnet, SNMP, OPC UA, MQTT, and IEC 61850. It also describes a shared alarm pipeline across power, cooling, IT, network, and security, with deduplication, escalation chains, and acknowledgment.
For control, the page states that the software reads sensors, writes setpoints, and executes control logic with role-based permissions and an audit trail for each command. Security and life-safety events enter the same alarm pipeline as facility and IT events.
Deployment options include customer premises, air-gapped environments where required, private cloud, a partner’s IaaS tenant, and hybrid configurations. The page also describes edge monitoring and control that continue operating during a WAN outage.
Dashboards, alarm rules, and workflows are built visually in a browser using the low-code Iotellect platform.
One limitation matters for teams seeking traditional DCIM planning capabilities: asset inventory, rack and space management, and capacity planning are listed as next on the product roadmap.
What a Unified Operations Layer Should Deliver
A unified operations layer should help teams follow an incident across equipment and organizational boundaries. For the cooling fault described at the start, that means connecting the facility alarm, the affected IT assets, and the incident record through consistent identities and timestamps.
The architecture should make those relationships visible while preserving network segmentation, scoped command rights, and independent life-safety functions. Those are concrete requirements to test during evaluation and acceptance.
Comments
Loading comments…