A dashboard shows 240 beside a red arrow. Is that milliseconds, failed requests or a change since yesterday? The number may be accurate, yet the presentation leaves the engineer guessing. Numeric typography begins with making the value interpretable, then making it easy to compare with related values.
For developers building monitoring tools, readable numbers require more than a font choice. Units, precision, alignment and missing-data states belong to the same component contract. A good implementation preserves those distinctions when the values update, the language changes or the layout narrows.
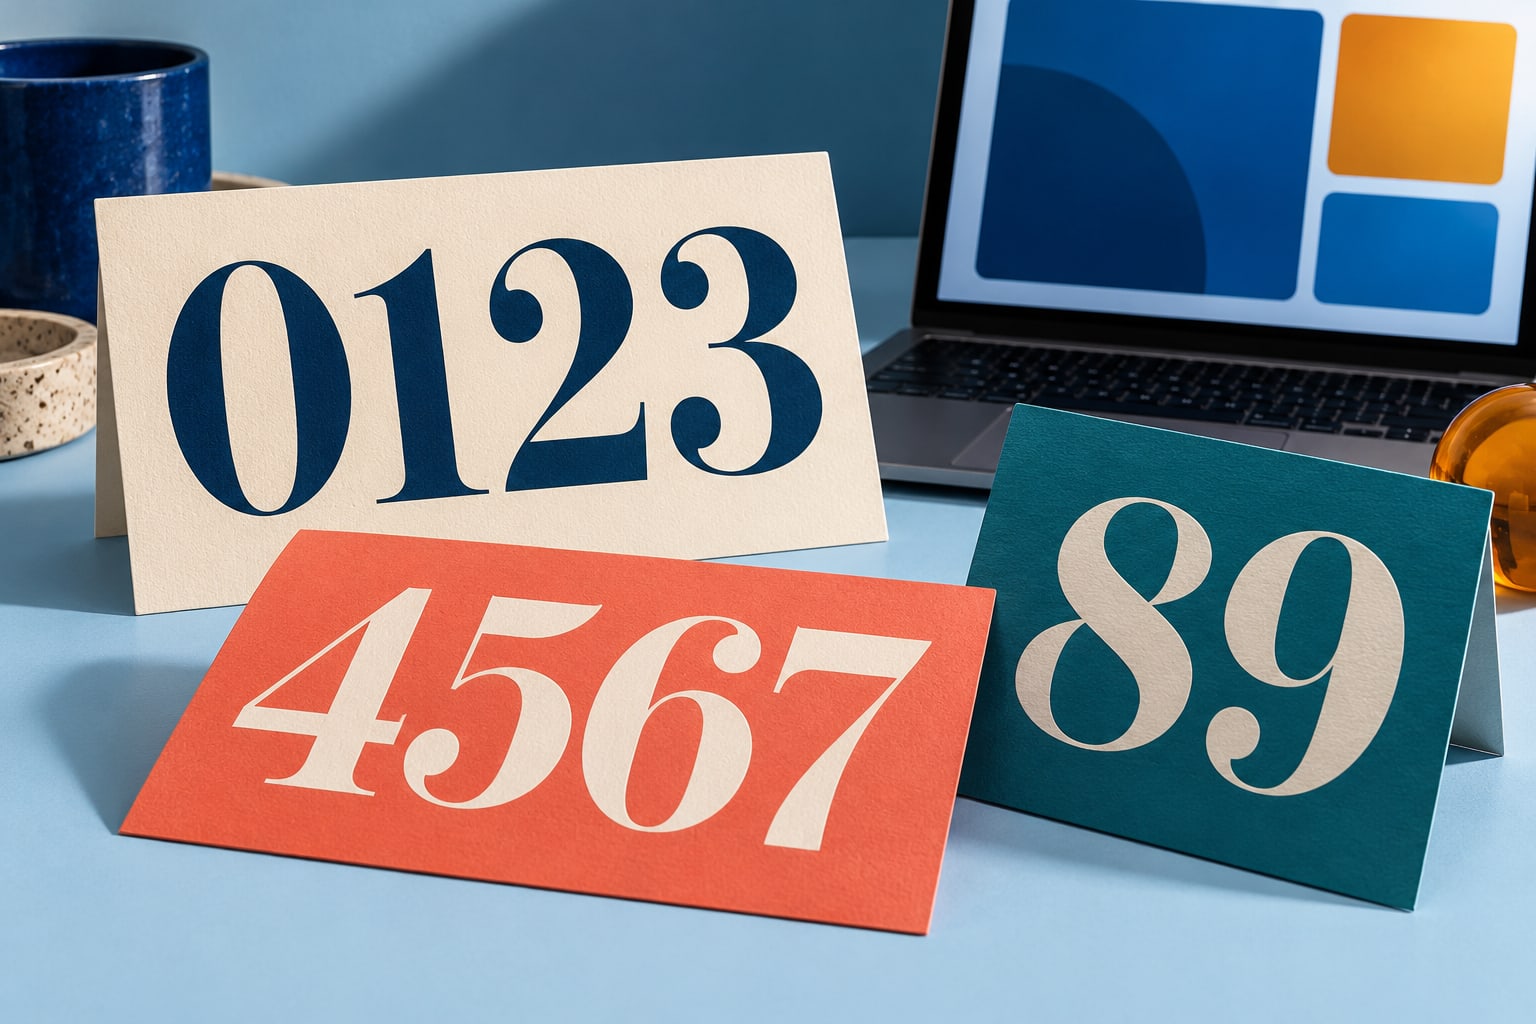
Editorial illustration of numeric typography. These specimen cards are not a demonstration of a named commercial font or measured dashboard performance.
Define the meaning before styling the metric
For each metric, write down its name, unit, aggregation and time window. Distinguish a current count from a rate, and an average from a percentile. A card labelled “Latency” gives less context than one labelled “P95 latency” with milliseconds and the relevant reporting window visible nearby.
This guide moves from a metric contract to number formatting, CSS alignment, accessible states, font selection and release checks. The examples use demonstration data and do not describe a live service.
Centralise the display rule
MDN describes Intl.NumberFormat as enabling “language-sensitive number formatting.” Use a shared formatter for repeated values instead of assembling separators and symbols by hand. The example below fixes one decimal place for a percentage and treats null as missing data. Its finite-number check also rejects accidental strings and non-finite numeric values.
const errorRate = new Intl.NumberFormat("en-US", { style: "percent", minimumFractionDigits: 1, maximumFractionDigits: 1 }); function formatErrorRate(value) { if (value === null || !Number.isFinite(value)) { return "No data"; } return errorRate.format(value); } formatErrorRate(0.018); // "1.8%" formatErrorRate(0); // "0.0%" formatErrorRate(null); // "No data"
This function formats an already validated ratio. It does not define the business rules for which requests count as failures, enforce a valid range or repair an upstream calculation. Keep that validation in the relevant data layer and document the assumptions in the component tests.
Use the application’s chosen locale in production. A dashboard shared across regions should not depend on an undocumented browser default when readers need consistent exports. Decide whether exported reports follow the viewer’s locale or an agreed reporting convention, then label that convention where it matters.
Separate digit spacing from number formatting
A typeface may provide proportional figures, where digits have different widths, and tabular figures, where their advance widths match. Tabular figures are useful in repeated values because changing a digit need not change the width occupied by that digit. The font must include the relevant feature for the setting to have the intended effect.
.metric-value, .numeric-cell { font-variant-numeric: lining-nums tabular-nums; } .numeric-cell { text-align: right; white-space: nowrap; }
MDN documents these options under font-variant-numeric. Lining figures share a baseline, while tabular figures support equal-width digit spacing. These settings do not insert grouping separators, choose decimal precision or align decimal points by themselves. Treat the JavaScript formatter and the CSS feature as separate responsibilities.
Align comparable values deliberately
For an English-language table of durations with the same unit and precision, right-aligned cells provide a consistent edge for comparison. Put the unit in the column heading when it applies to every value. If units differ, either normalise them for the comparison or make the distinction explicit in each row.
For example, a hypothetical list containing “900 ms” and “1.2 s” is understandable individually, but comparing the raw numerals encourages a mistake. A consistent duration unit makes the ordering easier to inspect. The data should also sort by the underlying numeric duration rather than by the formatted strings.
The nowrap rule above is limited to short numeric cells. Do not apply it to a whole dashboard: long labels and explanations need room to wrap. On a narrow display, make a deliberate decision about scrolling, stacked rows or a reduced set of columns rather than squeezing every value into tiny type.
Choose precision that preserves the useful distinction
A card that rounds a small nonzero error rate to 0.0 percent can conceal information the user needs. Decide whether to show more decimal places or a clearly defined threshold label such as less than 0.1 percent. That choice should follow the purpose of the metric, not the space left in the design.
Keep detailed values available where the task needs them. Compact notation can help an overview, but a label such as 12K should not become the only representation when someone needs an exact count. If a drill-down reveals the full value, make that interaction visible and available without relying solely on hover.
Do not make colour carry the entire status
The W3C’s guidance on use of colour advises: “Use information in addition to color, such as shape or text, to convey meaning.” A coloured dot can support a visible status label, but it should not be the only indication that data is stale or a threshold was exceeded.
Similarly, an increase is not always good and a decrease is not always bad. A higher throughput and a higher failure rate need different interpretations. Label the quantity and comparison basis before choosing the colour, and reserve warning language for a defined condition rather than any movement in the number.
Keep tables meaningful beyond their appearance
The W3C’s tables tutorial explains the need for structural markup to associate data with its headers. For a simple HTML metrics table, use a caption and appropriate header cells rather than visually arranging unrelated text into a grid. Styling can improve scanning, but it cannot establish those relationships for assistive technology.
For frequently updating views, review what happens while a user reads or interacts. Avoid reordering a table unexpectedly under the pointer. Consider a pause or manual refresh option where appropriate, and test any announcements with assistive technology instead of assuming that announcing every update is helpful.
Choose fonts using the content of the product
Build a specimen from your actual labels and number formats. Include zeros, ones, negative values where valid, percentages, decimal separators and the largest plausible count. Test the supporting text as carefully as the headline number; a beautiful value is not useful when its unit or qualifier becomes hard to read.
Two real custom-font projects show why requirements belong in the brief. The foundry’s published work includes a customised TT Fors for Plugsurfing, a developer of an app for finding EV charging points. Sartorius uses a customised TT Norms® Pro as its corporate font and as the basis of its logo. These are examples of fonts adapted for particular organisations and products.
Neither case establishes a measured improvement in dashboard readability. For a monitoring team, the transferable lesson is to specify the work the font must do. Required scripts, available weights, number features and small labels are concrete evaluation criteria; an association with a familiar brand is not a substitute for testing them.
Include licensing in the implementation brief
When evaluating families at typetype.org, use the metric specimen and identify the planned delivery formats. A browser dashboard, an embedded mobile interface and a static report can involve different permissions. Check the agreement before adding font assets to a production build or handing them to collaborators.
The foundry separates Desktop, Webfont and App licensing. Its webfont scope considers monthly pageviews and duration, while app licensing considers the applications containing the font. Explain any server-generated reports, downloadable publications or unusual distribution arrangements to the supplier rather than inferring coverage from a desktop purchase.
Keep approved font files and licensing records together. Do not assume permission to redistribute the files in a public repository, convert them or subset them merely because the software can do so. Clarify the intended operation under the applicable agreement and use supplied webfont files where appropriate.
Frequently asked questions
Does a monitoring dashboard need a monospace font
Not necessarily. A proportional text family with suitable numeric features can work well for labels and values. Monospace may be useful for identifiers or logs, but it is not a requirement for every metric. Compare the actual characters and line lengths at the intended display size.
Do tabular figures align decimal points automatically
No. Equal digit widths are only one part of alignment. Consistent precision, units and cell alignment also matter. If rows intentionally use different decimal precision, decide whether decimal alignment is required and implement a layout that supports it without making the text inaccessible.
Should missing data be displayed as a dash
A dash can work if its meaning is clear, but it should not leave users guessing between unavailable, not applicable and zero. Explicit text is often easier to interpret. Keep loading, stale data and permanent absence distinguishable when those states lead to different actions.
Can a single number formatter handle every metric
Use shared infrastructure, but define separate configurations for different quantities. A count, duration and fractional error rate have different units and precision rules. Centralise those configurations so that cards, tables and exports do not each invent their own interpretation of the same field.
How should a team evaluate a replacement font
Compare the existing and proposed families with the same content, widths and application states. Include the fallback, supported scripts, long labels and numeric features. Review any changed line breaks or missing glyphs before considering a visual preference. A replacement also needs an appropriate licence for the deployed product.
Review the number as a complete statement
Before shipping, ask a colleague to explain a metric without opening its implementation. They should be able to identify the quantity, unit, interval and data state. If the explanation is ambiguous, fix that relationship before adjusting the visual style.
· Verify formatting against representative input values.
· Keep units and qualifiers readable next to the number.
· Preserve the distinction between zero, unavailable and stale.
· Review narrow layouts, locale changes and fallback fonts.
The strongest numeric interface makes comparison straightforward while preserving the meaning of the data. Typography contributes through stable figures, clear labels and deliberate emphasis. The formatter, component structure and data contract complete the job.
Comments
Loading comments…