
FastAPI has quickly become one of the most popular frameworks for building web APIs in Python, thanks to its simplicity and high performance. However, even in the world of blazing-fast APIs, there’s always room for improvement. If you want to fine-tune your FastAPI application for optimal performance, profiling is an essential tool in your arsenal.
Profiling allows you to identify bottlenecks and optimize your code effectively. In this article, we will dive into the world of profiling FastAPI applications to help you squeeze every last drop of performance out of your APIs.
What Is Profiling?
Profiling is the process of measuring the execution time and resource usage of your application’s code. It helps you identify which parts of your code are consuming the most CPU time, memory, or other resources. By pinpointing these bottlenecks, you can make informed decisions to optimize your application.
In the context of FastAPI, profiling can reveal inefficiencies in your endpoints, business logic, database queries, or any other part of your application. By profiling your FastAPI application, you can make data-driven decisions to enhance its overall performance.
Profiling Tools
FastAPI profiling can be performed using various tools, but two of the most commonly used ones are:
- cProfile: A built-in Python profiler that gives you a detailed breakdown of the time spent in each function and method. This is a very basic profiler, lacking in how results are been displayed. For more reads https://docs.python.org/3/library/profile.html
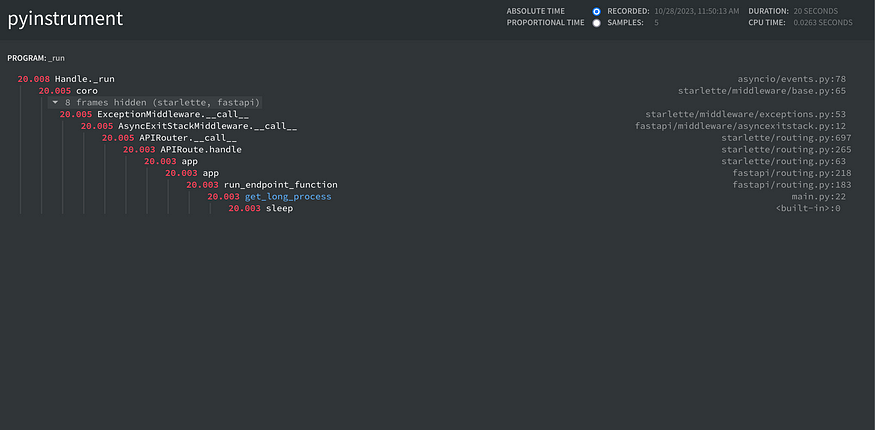
- Pyinstrument: A statistical python profiler which records call stack every 1 ms rather than recording the whole trace. This is done in order to avoid profiling overhead which can increase a lot if some functions are getting called many times and not taking that much time to complete. For more reads https://pyinstrument.readthedocs.io
Profiling with pyinstrument:
Step 1: Install dependencies. Run the code below
pip install pyinstrument fastapi uvicorn
Step 2: Create a simple profiler middleware class in main.py
#main.py
from pyinstrument import Profiler
from starlette.middleware.base import BaseHTTPMiddleware, RequestResponseEndpoint
from starlette.requests import Request
from starlette.responses import Response

class PyInstrumentMiddleWare(BaseHTTPMiddleware):
async def dispatch(self, request: Request, call_next: RequestResponseEndpoint) -> Response:
profiler = Profiler(interval=0.001, async_mode="enabled")
profiler.start()
response = await call_next(request)
profiler.stop()
# Write result to html file
profiler.write_html("profile.html")
return response
Step 3: Create a simple endpoint with the middleware added
app = FastAPI()

app.add_middleware(PyInstrumentMiddleWare)

@app.get("/process")
async  def  get_long_process():
# similulate a long running task
sleep(20)
return {"result":"result"}
Step 4: run the application using vscode launch. See sample launch file below
{
// Use IntelliSense to learn about possible attributes.
// Hover to view descriptions of existing attributes.
// For more information, visit: https://go.microsoft.com/fwlink/?linkid=830387
"version": "0.2.0",
"configurations": [
{
"name": "Python: FastAPI",
"type": "python",
"request": "launch",
"module": "uvicorn",
"args": [
"main:app",
"--reload"
],
"jinja": true,
"justMyCode": false
}
]
}
Send a get request to localhost:8000/process
profile.htmlwill be created within the root of the project. Open it in the browser to view possible application bottlenecks
For complete code check https://github.com/KelvinSajere/blog-posts/tree/main/profiling-fastapi
Thanks for reading. I try to post every week. Kindly follow me on Medium and LinkedIn https://www.linkedin.com/in/kelvinsajere/
Comments
Loading comments…