This guide shows how start-rate bursts, per-host concurrency, and rate limits — not just worker count — determine real throughput.
TL;DR: Concurrency is usually introduced as a performance tip. Parallelism is a good thing, so more workers should mean more requests, and more data. If ten workers are good, why not twenty? If twenty are great, why not fifty? The problem is that turning up concurrency doesn’t turn up just concurrency. It also decides how hard you hit the host at the very start, and, on multi-host workloads, per-host concurrency that you cannot predict.
When these “hidden” dials cause failures, they return HTTP 429s which look exactly like a concurrency cap. So you lower the pool or throw proxies at the problem (we’ll cover using those, too) and move on.
But unless you know what actually caused the problem, you’re probably leaving performance headroom on the table. I wanted to actually optimize for throughput, so I ran the hard numbers on those two non-intuitive limits.
My minimal benchmark harness is open source if you want to jump into the code and experiment yourself: concurrency-trap-bench.
Let’s dig in.
Part I — Concurrency Vs. Start Rate: Why One Pool Setting Controls Two Different Limits
First, two definitions, because everything in this part depends on them:
- Concurrency is how many requests are in flight right now. A semaphore (or
p-limit) caps this. - Start rate is how many new requests you begin per second. A rate limiter / token bucket caps this.
These are not the same setting, even though it really feels like they should be. If you hand a pool of 50 workers a list of 100 URLs, it will not gently ramp up to 50 requests over the first second. It will start all 50 as fast as the event loop can dispatch them — a massive, synchronized spike at t=0 -- and only then settle into your assumed "50 in flight" behavior as responses trickle back.
The data below is a case where that burst at the very start — how hard you hit the server at t=0 — is what actually got me blocked.
Measuring Start-Rate Burst
I chose ten Arch Wiki article URLs — a boring, stable, well-known target on purpose:
👉 See full urls-arch.txt in concurrency-trap-bench
https://wiki.archlinux.org/title/Arch_Linux
https://wiki.archlinux.org/title/Installation_guide
https://wiki.archlinux.org/title/Pacman
https://wiki.archlinux.org/title/Systemd
...and so on
This workload is fixed at 100 requests, cycling that 10-URL list, run through a p-limit pool. This is not a “fire N and wait” burst — so total work stays constant and the only thing I change between runs is the pool's concurrency limit.
👉 See full code for buildWorkload and runPooledFetch here in lib.js
function buildWorkload(urls, n) {
  return Array.from({ length: n }, (_, i) => urls[i % urls.length]);
}
async function runPooledFetch(urls, concurrencyLimit, agent, options = {}) {
  const limit = pLimit(concurrencyLimit);
  const results = await Promise.all(
    urls.map((url) => limit(() => fetchOne(url, agent)))
  );
  // ...
}
Here are the results.
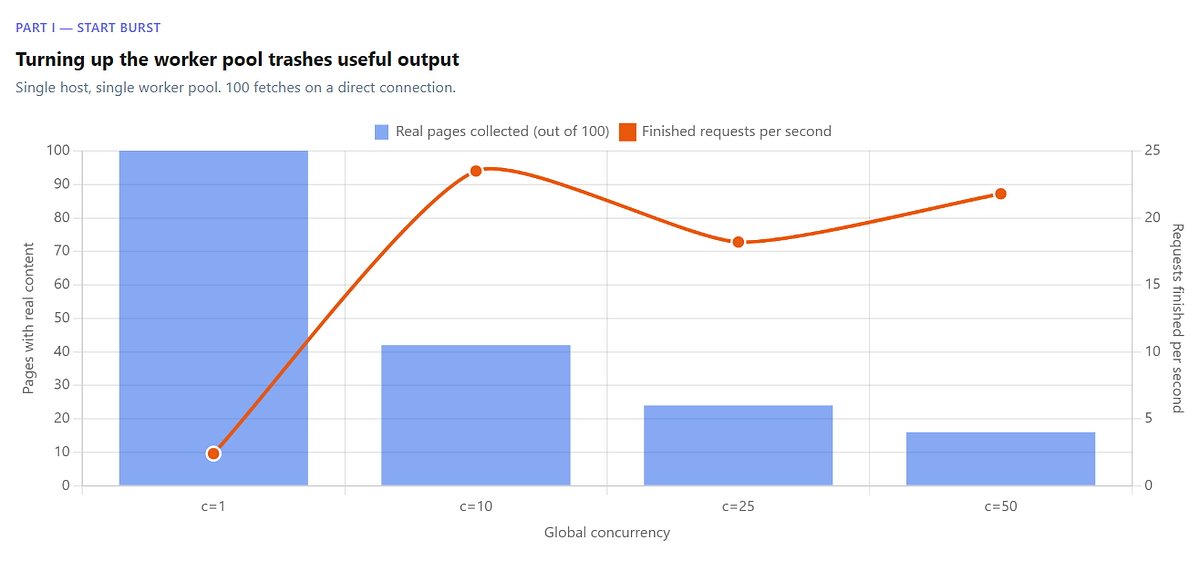
Useful Throughput Falls As Global Concurrency Rises
Here’s the direct sweep, fixed 100-request workload, with only the pool size changing:
| Concurrency | Data (ok) | Bans (429) | Completed req/s |
|---|---|---|---|
| 1 | 100 / 100 | 0% | 2.4 |
| 10 | 42 / 100 | 58% | 23.5 |
| 25 | 24 / 100 | 72% | 18.2 |
| 50 | 16 / 100 | 64% | 21.8 |
At c=1 — one request at a time, basically no concurrency — 100 requests out of 100 succeed, and completed req/s stays at 2.4/s (you’re waiting on full page renders, not firing in parallel). Bump the pool to 10 and useful data already falls off a cliff: 42 pages, 58% of the run rejected with 429s — but completed req/s jumps to 23.5/s. Push to c=25 and c=50 and ok keeps falling (24/100, then 16/100) while completed req/s stays in the high teens and twenties (18.2/s and 21.8/s).
Fig 1 — How completed requests per second can be misleading.
Notice the vanity metric doing its thing: c=10 peaks at 23.5 completed req/s — the highest in the table — while landing the second-worst ok count (only c=50 is worse). At c=25 and c=50, completed req/s is still 7–9 times that of c=1 even though bans dominate and real pages collected keep dropping.
If I stopped here, the obvious conclusion is “For MediaWiki targets, the concurrency limit is somewhere below 10, so cap the pool low.” Right?
Dead wrong, and here’s how I knew for sure.
Adding A Start-Rate Cap At The Same Concurrency Fixes It
If the problem were really “too many requests in flight,” then holding concurrency at 50 should stay broken no matter what else I do. So I ran exactly that — concurrency c=50, same 100-request workload — but added one thing: a cap on how fast new requests are allowed to start, independent of the pool size.
This harness gates each start behind a minimum gap, while leaving the pool free to keep 50 in flight:
👉 See full code for acquireStartSlot here in runPooledFetch
// minGapMs derived from --max-rps; pool concurrency is untouched
if (minGapMs > 0) {
  const now = Date.now();
  const waitMs = Math.max(0, nextStartAt - now);
  if (waitMs > 0) await sleep(waitMs);
  nextStartAt = Math.max(Date.now(), nextStartAt) + minGapMs;
}
Running this at concurrency 50 with the start rate capped at 2.4 req/s (eyeballing it to roughly 1/10th of our peak throughput which was with c=10):
| Run | Concurrency | Start-rate cap | Data (ok) | Bans |
|---|---|---|---|---|
| Naive | 50 | none | 16 / 100 | 64% |
| Paced | 50 | 2.4 req/s | 100 / 100 | 0% |
Same target. Same workload. Same 50-wide pool. The only difference is that requests were started at a measured pace instead of dumped out in one spike at t=0. But our useful data fetched went from 16/100 to 100/100, and bans went from 64% to a straight zero.
If you didn’t measure start burst (and add this fix as a result), you’d turn down concurrency and lose out on valuable performance.
Why A Pooled HTTP Client Sends A Burst Of Requests At t=0
This is just how pooled clients behave. Give a pool of 50 a backlog of work and it does not ease in — it launches 50 requests immediately, because that’s its job.
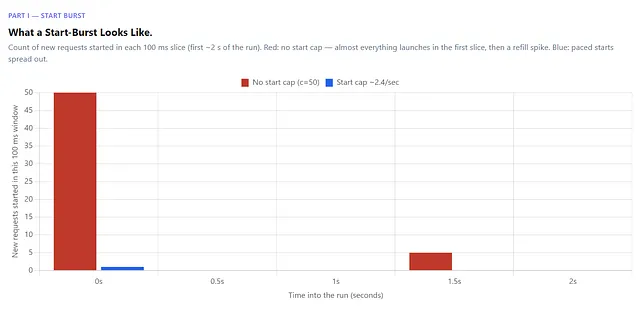
Fig 2 — What a burst at the start of the request looks like to the host. Same concurrency (c=50), naive method (red) vs. with our start cap in place (blue)
From the server’s side, your run opens with a wall of near-simultaneous requests, then goes quiet as responses come back. If your data source uses a per-source burst detector as a limiter, that won’t care that your average rate over the run is modest and polite; it will see the spike at the front and trip the circuit.
Concurrency (steady-state in-flight count) and start rate (the shape of the opening spike) usually move together when you just “turn up concurrency,” which is exactly why they’re so easy to conflate.
Isolating them — holding one fixed, while moving the other — is the only way to find out which one the target actually punishes.
Do Residential Proxies Fix Start-Rate Burst?
Here’s the part where I make the ugly distinction between correctness and engineering reality.
Pacing the starts is the correct fix — it collects the data without ever spiking the target. But often, you’ll run into situations where you’ll be like “I need this data, I need it fast, and throttling to 2.4 req/s is too slow.”
So how much do proxies help here? I ran the exact same naive sweep — no start-rate cap, pool bursting at t=0 as always — but routed through the residential proxies I have via Bright Data.
| Concurrency | Direct data (ok) | Direct bans | Residential data (ok) | Residential bans |
|---|---|---|---|---|
| 1 | 100 / 100 | 0% | 99 / 100 | ~0% |
| 10 | 42 / 100 | 58% | 99 / 100 | ~0% |
| 25 | 24 / 100 | 72% | 98 / 100 | ~0% |
| 50 | 16 / 100 | 64% | 98 / 100 | ~0% |
The direct connection of course craters exactly as before. Using a proxy, though, it holds ~98–99/100 with essentially zero bans at every concurrency level, burst and all.
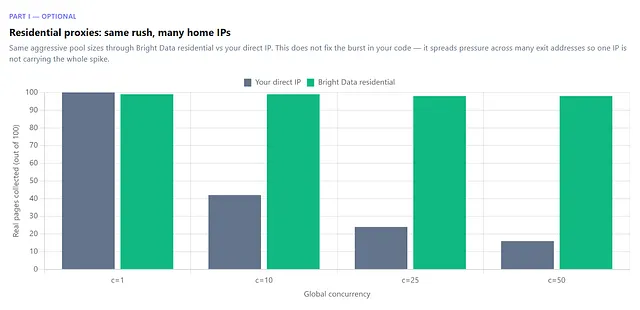
Fig 3— Direct IP vs Bright Data residential, by worker pool size.
If you’re in a situation where raw throughput matters above all, that’s where a residential proxy pool earns its keep — they do not fix the burst, but simply make the burst not matter. A higher safe-concurrency ceiling translates directly into more pages collected per hour at the same risk level. That’s the entire value proposition of a large, diverse IP pool.
Here’s how I do it. The pool code doesn’t change. You build a proxy agent from env creds and pass it into the same runPooledFetch / fetchOne path instead of null:
👉 See full code for buildProxyAgent here in lib.js
function buildProxyAgent() {
  const user = process.env.BRIGHT_DATA_PROXY_RESIDENTIAL_USERNAME;
  const pass = process.env.BRIGHT_DATA_PROXY_RESIDENTIAL_PASSWORD;
  if (!user || !pass) return null;
  const host = process.env.BRIGHT_DATA_PROXY_HOST || 'brd.superproxy.io';
  const port = process.env.BRIGHT_DATA_PROXY_PORT || '33335';
  const proxyUrl = `http://${encodeURIComponent(user)}:${encodeURIComponent(pass)}@${host}:${port}`;
  return new HttpsProxyAgent(proxyUrl);
}
const residentialAgent = buildProxyAgent();
await runPooledFetch(tasks, 50, residentialAgent);
If you want to follow along with the optional proxy comparison in this tutorial, sign up to get those proxy credentials here. New accounts get 5,000 free credits per month with a hard stop when credits run out so there’s no surprise billing.
If you genuinely need to crank concurrency for speed and can’t pace the starts, residential proxies let you get away with the burst you’ll incur. It’s a “buy your way out” escape hatch.
Part II — Per-Host Concurrency
Everything in Part I happened against a single host. In that world, life is simple: if your global concurrency is 50, then that one host can potentially see all 50 requests.
Real crawlers almost never look like that. They fetch documentation from one site, a JSON response from an API, maybe metadata from somewhere else, all through the same worker pool. That’s why a single global concurrency limit you configured doesn’t mean much when multiple hosts are in play.
Almost every concurrency tutorial hands you a single global semaphore:
const limit = pLimit(50);
await Promise.all(urls.map((url) => limit(() => fetchOne(url))));
Most people see a limit of 50 and instinctively think, "That makes sense -- I'm making at most 50 concurrent requests."
But the subtle mistake is assuming global concurrency also tells you what any individual host experiences. Per-host concurrency must be measured separately.
Imagine your queue looks something like this:
1. arch
2. github
3. arch
4. mdn
5. npm
6. arch
7. cloudflare
The scheduler isn’t trying to spread requests evenly across hosts. It simply hands the next available worker whatever job comes next in the queue. Which means some hosts might briefly have two requests in flight, while another has twenty. You set a global worker pool, yes, but you never configured these numbers. They emerge from queue order, response times, and the mix of hosts in your workload.
That’s why global concurrency of c=50 is only ever a statement about the worker pool. Global concurrency tells you nothing about how many concurrent requests any one host actually saw.
To talk about this, we need to first define three things:
- Global concurrency is the size of your shared worker pool. This is a number you set.
- Per-host concurrency — the maximum number of simultaneous requests a single host actually observed during the run. What you have to measure.
- Per-host cap — an optional second limiter that bounds in-flight requests per hostname, inside the global pool.
They’re all different things — and this is exactly the point of this part of my post. Global concurrency is scheduler bookkeeping. Per-host concurrency is what the server actually feels, and it’s the number that’s much more likely to predict who gets rate-limited.
Benchmarking Per-Host Concurrency
We can reuse the same harness, same success taxonomy, but now our workload deliberately mixes two hosts:
- A strict host — Arch Linux Wiki (10 article URLs). Blocks under pressure, exactly like Part I.
- A lenient host — We can use the scraping sandbox books.toscrape.com for this (10 catalogue pages). A site that exists to be scraped; it basically never blocks, so it’s our control setup. If this source ever fails, we know our code is broken.
The URL list in urls-mixed-arch-books.txt already alternates hosts — Arch, books, Arch, books — so a naive, default round-robin cycle gives you 20 distinct URLs x 5 repeats = 100 requests at global concurrency 50:
👉 See full list in urls-mixed-arch-books.txt in concurrency-trap-bench
https://wiki.archlinux.org/title/Arch_Linux
https://books.toscrape.com/catalogue/page-1.html
https://wiki.archlinux.org/title/Installation_guide
https://books.toscrape.com/catalogue/page-2.html
https://wiki.archlinux.org/title/Pacman
https://books.toscrape.com/catalogue/page-3.html
...and so on
👉 See full code for buildOrderedWorkload here in lib.js
function buildOrderedWorkload(urls, pattern, { repeatsPerUrl = 5, seed = null } = {}) {
  const n = urls.length * repeatsPerUrl;
  let list = Array.from({ length: n }, (_, i) => urls[i % urls.length]);
if (pattern === 'block') {
    // AxN, BxN, and so on. Repeat each URL before advancing.
    const out = [];
    for (const url of urls) {
      for (let i = 0; i `< repeatsPerUrl; i++) out.push(url);
    }
    return out;
  }
if (pattern === 'shuffle') {
    // Fisher–Yates with a fixed seed so the run is reproducible
    for (let i = list.length - 1; i >` 0; i--) {
      seed = (Math.imul(1664525, seed) + 1013904223) >>> 0;
      const j = seed % (i + 1);
      [list[i], list[j]] = [list[j], list[i]];
    }
  }
  // 'round-robin' leaves the alternating list as-is
return list;
}
Global concurrency is still just p-limit(50). The pool doesn't know or care about hostnames — it only sees the next URL in whatever order we handed it.
To measure per-host concurrency, the harness records startedAt and duration for every request, then reconstructs peak simultaneous in-flight count per hostname (peak_inflight) by sweeping start/end events:
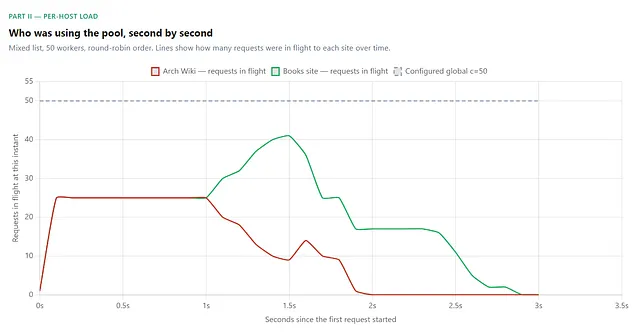
Fig 4 — Worker pool usage by each host when Round Robin scheduling is used.
👉 See full code for maxConcurrentPerHost here in lib.js
function maxConcurrentPerHost(results) {
  const eventsByHost = new Map();
  for (const r of results) {
    const host = new URL(r.url).hostname;
    if (!eventsByHost.has(host)) eventsByHost.set(host, []);
    const end = r.startedAt + r.ms;
    eventsByHost.get(host).push({ t: r.startedAt, delta: 1 }, { t: end, delta: -1 });
  }
  // sort events by time, sweep: +1 on start, -1 on finish, track max
}
That number is per-host concurrency — what the server actually felt, not what you configured.
How Queue Order Changes Per-Host Concurrency
Part I proved that holding global concurrency fixed while changing start rate can flip outcomes entirely. Part II needs the same discipline: same global c=50, same 100 URLs, same two hosts — only the order of the queue changes.
Why bother? Because like I said earlier: in a real crawler the queue order is never perfectly round-robin. URLs arrive from a sitemap, a dependency graph, a retry queue — multiple sources. Two runs with identical global settings will produce different orderings by accident. If per-host pressure is an emergent property of queue order, we need to deliberately stress that — and not assume round-robin is representative.
So I try three patterns here, as demonstration:
1. Round-robin: alternating hosts evenly through the queue
By default this is the alternating list as written (A B A B …, repeated). Spreads hosts evenly through the queue.
2. Block: clustering same-host requests together
Repeat each URL N times before advancing (A A A A A B B B B B …). Clusters same-host work together instead of interleaving it.
3. Shuffle (seed 42): a randomized queue order
Run Fisher–Yates on the round-robin list. Mimics a messy real queue where URLs from the same host happen to land adjacent by accident.
Here are the results:
| Pattern | Books ok | Books peak-in-flight | Arch ok | Arch bans | Arch peak-in-flight |
|---|---|---|---|---|---|
| Round-robin | 50 / 50 | 43 | 19 / 50 | 62% | 25 |
| Shuffle (seed 42) | 50 / 50 | 44 | 22 / 50 | 60% | 34 |
| Block | 50 / 50 | 45 | 19 / 50 | 62% | 25 |
Look at that peak_inflight column for the Arch Linux wiki for a second. The worker pool was c=50 wide the entire time, but Arch never once saw 50 concurrent requests — it topped out somewhere in the mid-20s to mid-30s. The other host was actually consuming most of the pool: the books sandbox peaked at 43–45 in flight while Arch sat well below the number we actually configured.
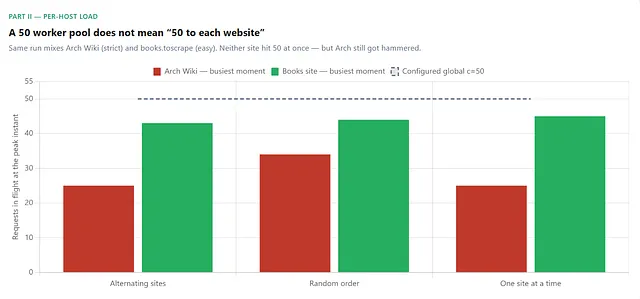
Gray dashed line: what you typed in config (50). Bars: most simultaneous requests each site actually saw.
If you set a global concurrency/worker pool limit for multiple hosts, it will distribute itself across your hosts however the schedule happened to shake out — no way to predict how.
Same Global Concurrency Setting, Different Per-Host Pressure.
Again, look at that table for what shuffle/random ordering did. Global concurrency didn’t change — it’s 50 in every row. But Arch's measured per-host concurrency jumped from 25 (with round-robin/block) to 34 (with shuffle), purely because reordering the queue happened to cluster more Arch URLs into the same instant.
And that DID change the outcome — just not in the direction you’d guess from peak pressure alone. Shuffle collected 22/50 on Arch where round-robin and block each got 19/50. A modest swing.
💡 Reordering the queue changed the instantaneous per-host pressure and the success count, even though global concurrency never moved.
The point I’m trying to drive home is that a single global concurrency setting can be misleading. It does not uniquely determine what any host experiences — the same 50 produced a range of per-host concurrency peaks (25–34 here) and a range of outcomes (19–22 ok here). On a different day (rate limiters are stateful), a swing in per-host concurrency is exactly what tips one run into more bans than another.
Fix: Limit Per-Host Concurrency Separately
Part I’s fix was a start-rate cap — a second limiter beside the pool, gating how fast new requests begin. Part II’s fix is the same idea on a different axis: a per-host cap — a second limiter beside the pool, gating how many requests to one hostname can be in flight at once.
Recall the three terms from the start of Part II:
- Global concurrency — the shared pool size (
p-limit(50)). You set this. - Per-host concurrency — what any one host actually saw (
peak_inflight). You measure this. - Per-host cap — an optional ceiling on the second number, enforced inside the first.
Without a per-host cap, the global pool is a free-for-all: whichever URLs happen to be runnable next fill the slots, and a single strict host can inherit a burst it never agreed to. With one, each hostname gets its own nested semaphore:
👉 See full code for runPooledFetch with perHostLimit here in lib.js
async function runPooledFetch(urls, concurrencyLimit, agent, { perHostLimit } = {}) {
  const globalLimit = pLimit(concurrencyLimit);
  const hostLimiters = new Map();
  async function fetchWithLimits(url, execute) {
    return globalLimit(async () => {
      if (perHostLimit && perHostLimit >= 1) {
        const host = new URL(url).hostname;
        if (!hostLimiters.has(host)) hostLimiters.set(host, pLimit(perHostLimit));
        return hostLimiters.get(host)(execute);
      }
      return execute();
    });
  }
  // ...
}
Every request still passes through the global p-limit(50) first. But before it actually fires, it also acquires a slot on that hostname's private p-limit(5). The pool stays 50 wide — you can still have 50 requests in flight across all hosts — but no single host can hold more than 5 of those slots.
Now the controlled comparison, in the spirit of Part I’s paced run. Same mixed workload, same round-robin order, global concurrency stays 50. The only change: --per-host-limit 5.
| Run | Global c | Per-host cap | Total ok | Arch ok | Arch bans | Arch peak | Books peak |
|---|---|---|---|---|---|---|---|
| Global only | 50 | none | 71 / 100 | 21 / 50 | 58% | 25 | 42 |
| Global + per-host cap | 50 | 5 | 92 / 100 | 42 / 50 | 16% | 5 | 5 |
I did not lower the global pool. It’s still 50 workers. I simply added a second limiter that bounds each host to 5 concurrent requests (adjust this as you see fit.)
For the Arch Linux wiki, good data doubled (went from 21/50 to 42/50), its ban rate fell from 58% to 16%, and books stayed a perfect 50/50 the whole time. Both hosts now peak at exactly 5 in flight — the pool is still 50 wide, but now, no single host is being hit harder than the per-host cap allows.
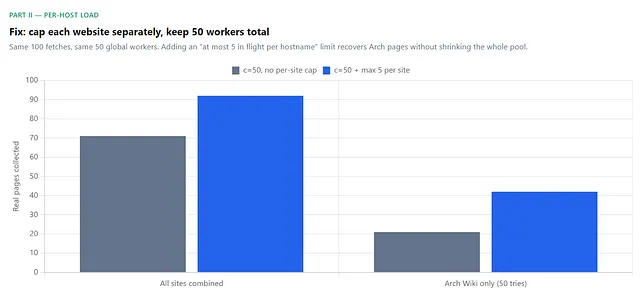
With only two hosts, obviously you can raise this beyond 5 with no ill effects and even more performance.
Note that even with this, a ban rate of 16% is not insignificant. A per-host cap substantially mitigates the problem; it doesn’t magically make your data fetching bulletproof (there’s still no start-rate cap here, and the IP carries state across runs).
But the improvement is unambiguous, and — crucially —we recovered that data without throwing away the throughput headroom that lowering global concurrency to 1 would have cost.
💡 Proxies can help here, too. Routing the same mixed workload through a rotating residential pool can make a strict host more forgiving at the same per-host peak — a burst of concurrent requests gets spread across multiple exit IPs, so fewer of them trip a limit. This still only buys you tolerance though, not correctness.
Why A Shared Worker Pool Concentrates Load On One Host
The pool fills its 50 slots with whatever is runnable. If the lenient host answers fast, its requests complete and free slots quickly, so more of its work flows through — but whenever a cluster of strict-host URLs comes due together, they pile into the pool simultaneously and hand that host a burst it never agreed to.
How big that burst is depends on ordering, response times, and host mix — none of which appear in the single number you set.
That’s why the fix is a per-host limiter, not a smaller global one. Lowering global concurrency throttles every host equally, including the lenient one that was doing fine, and still doesn’t pin down what the strict host sees. A per-host cap targets exactly the variable that predicts bans.
How can I optimize concurrent scraping tasks for performance?
Here’s some actionable advice I actually want you to walk away with.
- Treat start rate as its own setting. A semaphore is not a requests-per-second limiter. Add an explicit start-rate cap alongside your concurrency cap.
- Treat per-host concurrency as its own setting, too. If your workload spans multiple hosts, add a per-host limiter inside the global pool.
- How do you know which limit is causing bans? Log
observed_start_rpsand per-hostpeak_inflight. You can't reason about a limit you never measured. - Measure useful throughput, not completed requests. A fast 429 is still a failed fetch. Optimize for
ok-per-second, not requests-per-second.
The exact numbers in this post aren’t the point. Rate limiters are stateful, so they’ll change with time, traffic history, and IP reputation. What shouldn’t change is the pattern: a failure that looks like “too much concurrency” can turn out to be a start-rate problem, a per-host scheduling problem, or something else entirely.
Until you isolate those variables, lowering the pool size is merely fixing the right symptom for the wrong reason. Don’t waste your time.
Comments
Loading comments…