Hi guys in this blog, we will see how to create a Line Chart using Swift Charts using SwiftUI. Follow along with this blog and have fun ✌️. At the bottom of that blog, you can get the complete code.
Simple Line Chart
First of all, import the Charts. Then create an enum type LineChartType. We will use that enum type to design multiple lines on the graph.
The following enum has two types with a computed property of color which will return the color concerning every enum type.
import Charts

enum LineChartType: String, CaseIterable, Plottable {
    case optimal = "Optimal"
    case outside = "Outside range"

    var color: Color {
        switch self {
        case .optimal: return .green
        case .outside: return .blue
        }
    }

}
Now create a struct LineChartData. A list of LineChartData will be used to plot graph lines. LineChartData should be identifiable and will contain date, value, and type.
struct LineChartData {

    var id = UUID()
    var date: Date
    var value: Double

    var type: LineChartType
}
Now create a LineChartView, which takes a list of ListChartData as a parameter. Use a VStack and give 360 height. Inside VStack write a Text for giving title to the graph and then use Chart.
Inside Chart, you need to iterate the data and use the LineMark view. LineMark view will make a line for every point and those lines will connect and create a line chart. LineMarrk is taking x, y parameters. You need to specify which value should be plotted on the x-axis and which on the y-axis.
struct LineChartView: View {

    let data: [LineChartData]

    var body: some View {
        VStack(alignment: .leading) {
            Text("Line Chart")
                .font(.system(size: 16, weight: .medium))

            Chart {
                ForEach(data, id: \.id) { item in
                    LineMark(
                        x: .value("Weekday", item.date),
                        y: .value("Count", item.value)
                    )
                }
            }
        }
        .frame(height: 360)
    }
}
Now create two following Date extensions
- adding for add components to the Date
- startOfDay for getting the start time of the day
extension Date {
    func adding (_ component: Calendar.Component, value: Int, using calendar: Calendar = .current) -> Date? {
        return calendar.date(byAdding: component, value: value, to: self)
    }

    var startOfDay: Date {
        return Calendar.current.startOfDay(for: self)
    }
}
Now, it’s time to create some dummy data and use that data in the LineChartView.
Create the following chartData inside the ContentView and LineChartView inside the ContentView.
var chartData : [LineChartData] = {
    let sampleDate = Date().startOfDay.adding(.month, value: -10)!
    var temp = [LineChartData]()

    // Line 1
    for i in 0..<8 {
        let value = Double.random(in: 5...20)
        temp.append(
            LineChartData(
                date: sampleDate.adding(.month, value: i)!,
                value: value,
                type: .outside
            )
        )
    }

    return temp
}()
LineChartView(data: chartData)
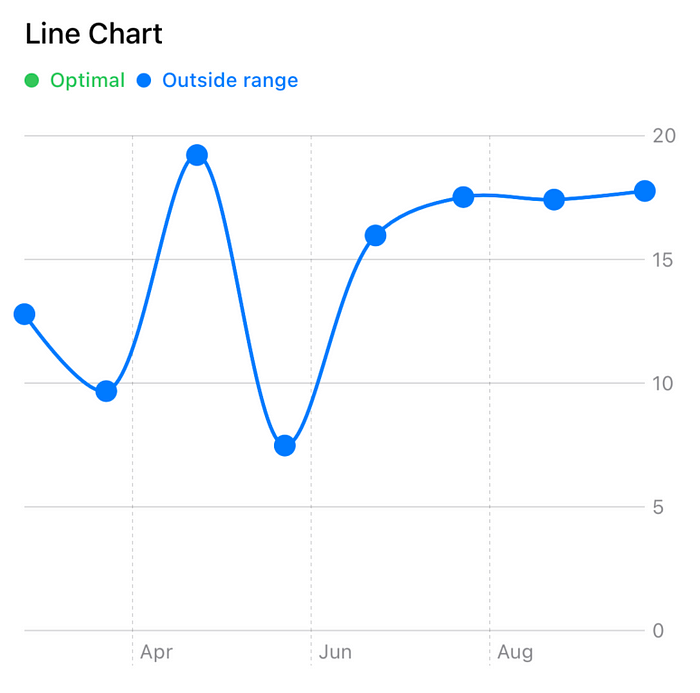
Now, run the app and you will see the following output 🚀🚀🚀🚀🚀.

Customizing Line Chart
Now, it’s time to customize the line chart. Apply the following properties on LineMark to customize the line chart.
- Use foregroundStyle for applying a given color to a line
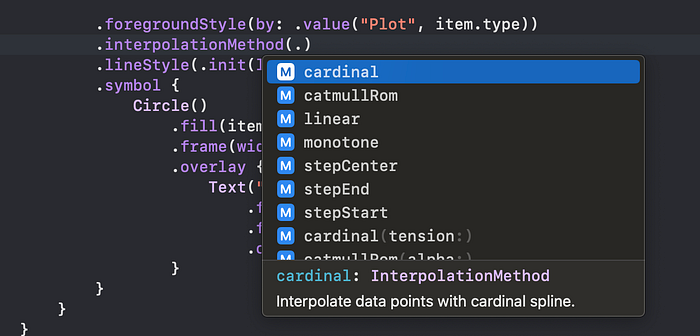
- Use interpolationMethod for changing the appearance of the line, by using .catmullRom the line will be rounded cover style.
- Use lineStyle to give a line width
- Use a symbol for adding any symbol on every point, here we are showing a circle on every graph point.
.foregroundStyle(item.type.color)
.interpolationMethod(.catmullRom)
.lineStyle(.init(lineWidth: 2))
.symbol {
    Circle()
        .fill(item.type.color)
        .frame(width: 12, height: 12)
        .offset(y: -15)
}
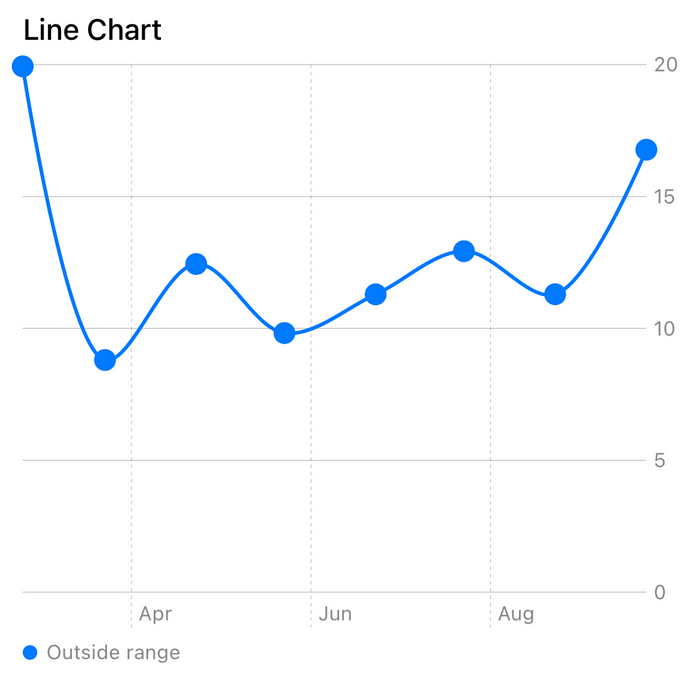
Now run the app and you will see the following output.

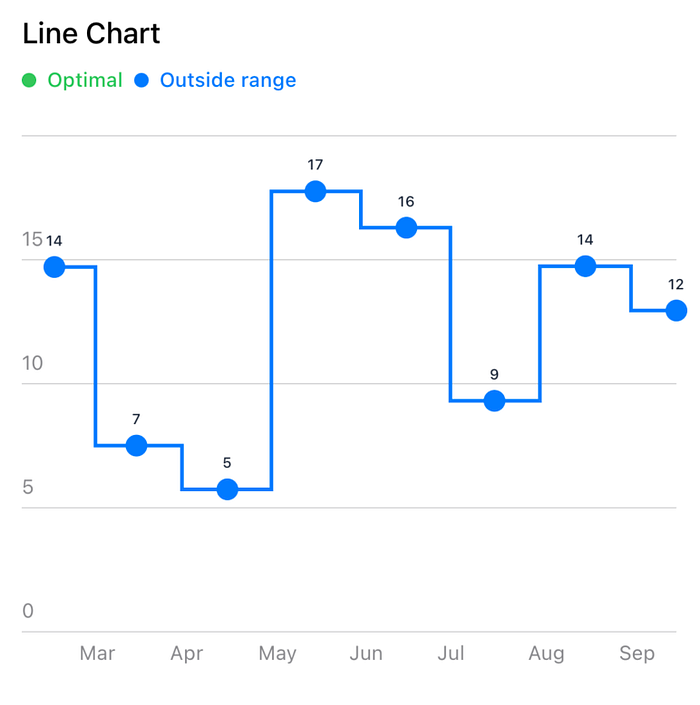
If you need to change the style of the graph then use interpolationMethod for that like if we give the type stepCenter then you will see the following result
.interpolationMethod(.stepCenter)
You can use the following interpolation methods.
As you can see, we can not see the Chart Lagend View in that graph. To show Chart Legend View, you need to apply the following property on LineChart.
.foregroundStyle(by: .value(“Plot”, item.type))
Now, you can see the Chart Legend View at the bottom of the Chart. If you need to customize the Chart Legend View, you can apply the chartLegend modifier on the Chart like below.
.chartLegend(position: .top, alignment: .leading, spacing: 24){
    HStack(spacing: 6) {
        ForEach(LineChartType.allCases, id: \.self) { type in
            Circle()
                .fill(type.color)
                .frame(width: 8, height: 8)
            Text(type.rawValue)
                .foregroundStyle(type.color)
                .font(.system(size: 11, weight: .medium))
        }
    }
}
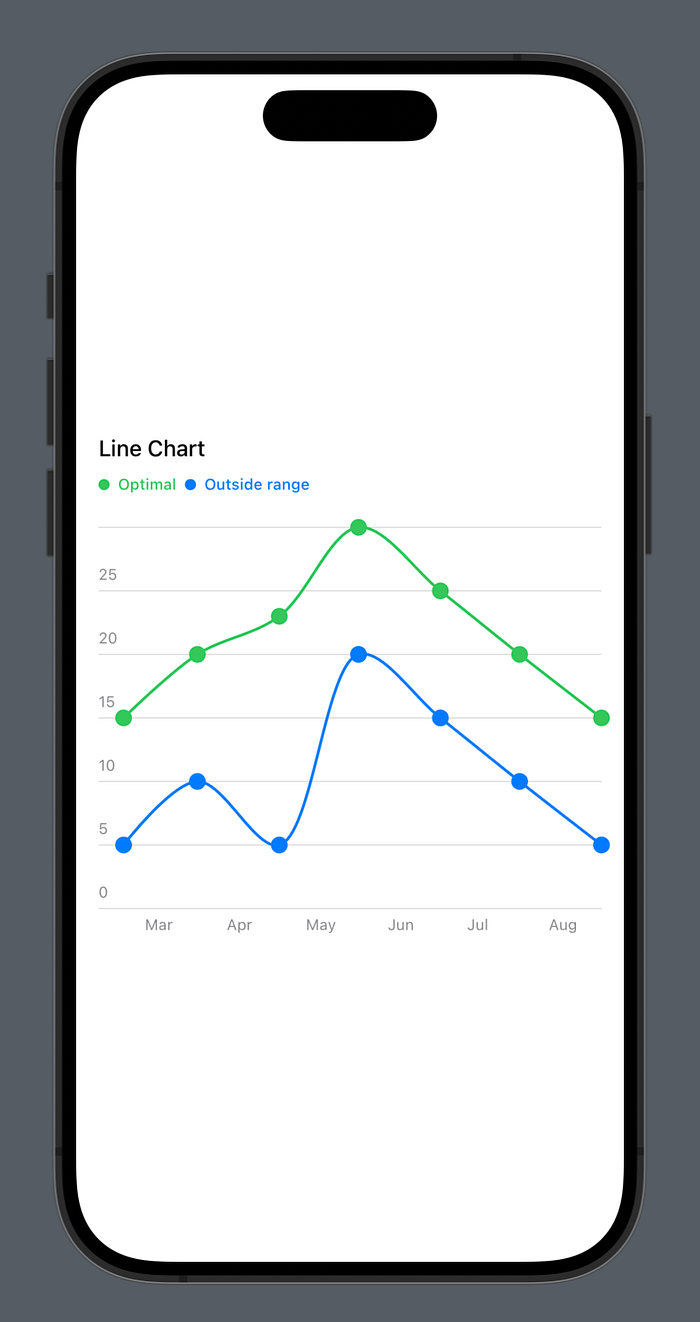
Here we are iterating all LineChartType cases and showing the circle and title of every type. Here we are giving position to the top and Chart Legend View will show on the top of the Chart as follows.
If you need to put a point value on the top of every point then you could use the overlay on the circle of point like below.
.overlay {
    Text("\(Int(item.value))")
        .frame(width: 20)
        .font(.system(size: 8, weight: .medium))
        .offset(y: -15)
}
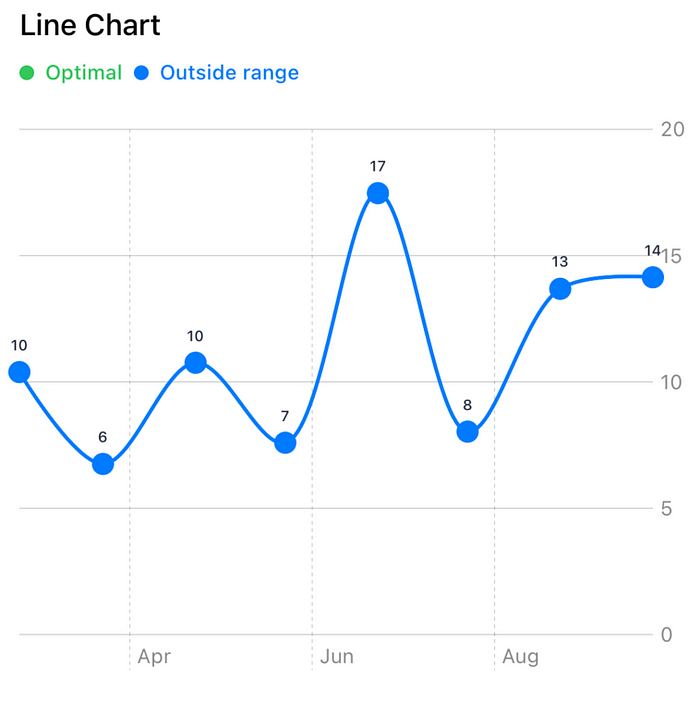
Then you will see the following output.
Now update the x-axis, y-axis as follows
.chartXAxis {
    AxisMarks(preset: .extended, values: .stride (by: .month)) { value in
        AxisValueLabel(format: .dateTime.month())
    }
}
.chartYAxis {
    AxisMarks(preset: .extended, position: .leading, values: .stride(by: 5))
}
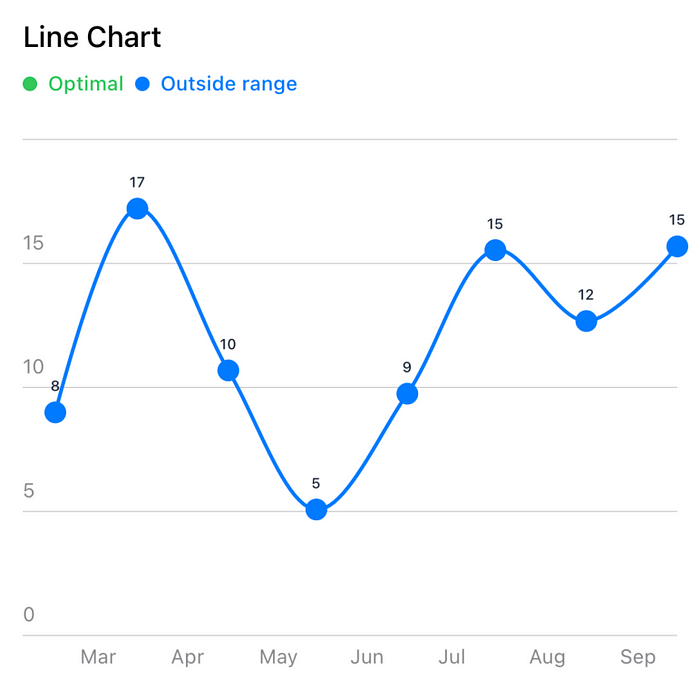
After applying these you will see the graph like this
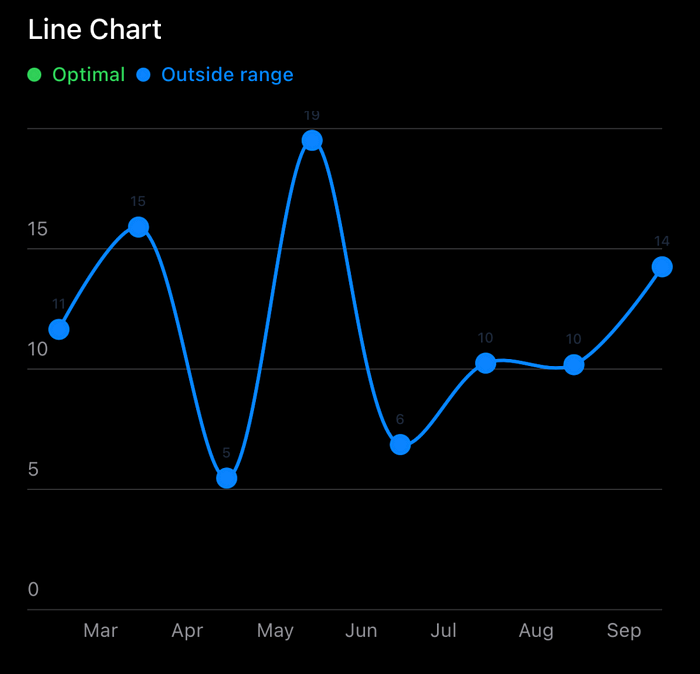
If you need to change the appearance of the chart to dark then you can apply the following modifier on Chart.
.preferredColorScheme(.dark)
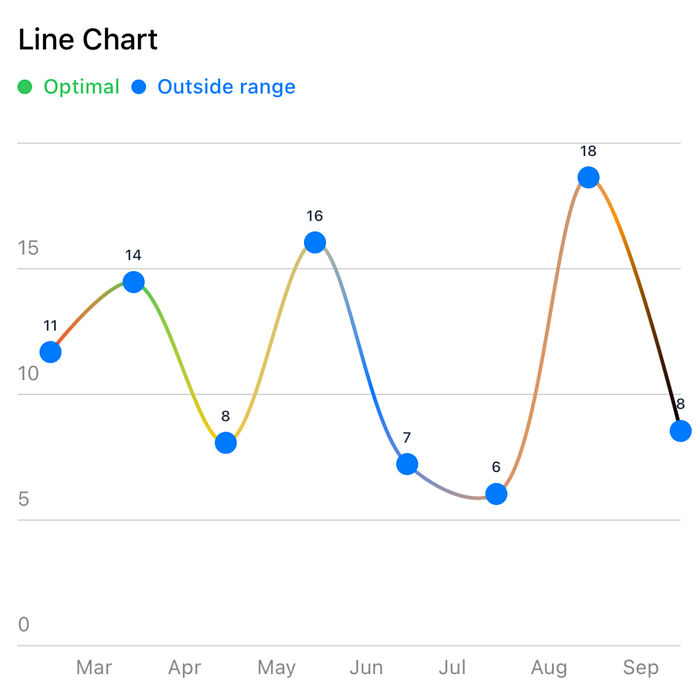
If you need to apply a gradient on the line then create a Gradient line below.
func getLineGradient() -> LinearGradient {
    return LinearGradient(
        stops: [
            .init(color: .red, location: 0),
            .init(color: .green, location: 0.1),
            .init(color: .yellow, location: 0.3),
            .init(color: .blue, location: 0.5),
            .init(color: .orange, location: 0.8),
            .init(color: .black, location: 1),
        ],
        startPoint: .leading,
        endPoint: .bottomTrailing
    )
}
Then apply the following modifier on the Chart
.foregroundStyle(getLineGradient())
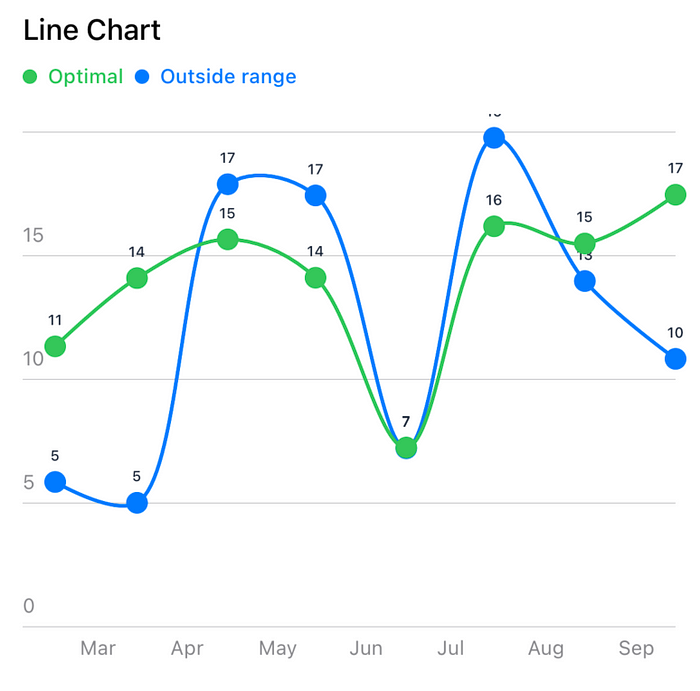
Multi-Line Chart
If you need to show multiple lines on the chart, you just need to update the chartData as follows and specify the different types for different lines.
var chartData : [LineChartData] = {
    let sampleDate = Date().startOfDay.adding(.month, value: -10)!
    var temp = [LineChartData]()

    // Line 1
    for i in 0..<8 {
        let value = Double.random(in: 5...20)
        temp.append(
            LineChartData(
                date: sampleDate.adding(.month, value: i)!,
                value: value,
                type: .outside
            )
        )
    }

    // Line 2
    for i in 0..<8 {
        let value = Double.random(in: 5...20)
        temp.append(
            LineChartData(
                date: sampleDate.adding(.month, value: i)!,
                value: value,
                type: .optimal
            )
        )
    }

    return temp
}()
Here you see 1st line objects list type will be .outside and 2nd line objects list type will be .optimal. These types should be different to show Multiple Lines on the graph. Now you will see the following Multiple Lines Chart.
So that’s it. Hope you guys enjoy that tutorial. Thanks for reading this.
Complete Code
import SwiftUI
import Charts

enum LineChartType: String, CaseIterable, Plottable {
    case optimal = "Optimal"
    case outside = "Outside range"

    var color: Color {
        switch self {
        case .optimal: return .green
        case .outside: return .blue
        }
    }

}

struct LineChartData {

    var id = UUID()
    var date: Date
    var value: Double

    var type: LineChartType
}

struct LineChartView: View {

    let data: [ LineChartData]

    var body: some View {
        VStack(alignment: .leading) {
            Text("Line Chart")
                .font(.system(size: 16, weight: .medium))

            Chart {
                ForEach(data, id: \.id) { item in
                    LineMark(
                        x: .value("Weekday", item.date),
                        y: .value("Value", item.value)
                    )

                    .foregroundStyle(item.type.color)
                    //                    .foregroundStyle(getLineGradient())

                    .foregroundStyle(by: .value("Plot", item.type))
                    .interpolationMethod(.catmullRom)
                    .lineStyle(.init(lineWidth: 2))
                    .symbol {
                        Circle()
                            .fill(item.type.color)
                            .frame(width: 12, height: 12)
                            .overlay {
                                Text("\(Int(item.value))")
                                    .frame(width: 20)
                                    .font(.system(size: 8, weight: .medium))
                                    .offset(y: -15)
                            }
                    }
                }
            }
            .chartLegend(position: .top, alignment: .leading, spacing: 24){
                HStack(spacing: 6) {
                    ForEach(LineChartType.allCases, id: \.self) { type in
                        Circle()
                            .fill(type.color)
                            .frame(width: 8, height: 8)
                        Text(type.rawValue)
                            .foregroundStyle(type.color)
                            .font(.system(size: 11, weight: .medium))
                    }
                }
            }
            .chartXAxis {
                AxisMarks(preset: .extended, values: .stride (by: .month)) { value in
                    AxisValueLabel(format: .dateTime.month())
                }
            }
            .chartYAxis {
                AxisMarks(preset: .extended, position: .leading, values: .stride(by: 5))
            }

//            .preferredColorScheme(.dark)
        }
        .frame(height: 360)
    }

//    func getLineGradient() -> LinearGradient {
//        return LinearGradient(
//            stops: [
//                .init(color: .red, location: 0),
//                .init(color: .green, location: 0.1),
//                .init(color: .yellow, location: 0.3),
//                .init(color: .blue, location: 0.5),
//                .init(color: .orange, location: 0.8),
//                .init(color: .black, location: 1),
//            ],
//            startPoint: .leading,
//            endPoint: .bottomTrailing
//        )
//    }
}

var chartData : [LineChartData] = {
    let sampleDate = Date().startOfDay.adding(.month, value: -10)!
    var temp = [LineChartData]()

    // Line 1
    for i in 0..<8 {
        let value = Double.random(in: 5...20)
        temp.append(
            LineChartData(
                date: sampleDate.adding(.month, value: i)!,
                value: value,
                type: .outside
            )
        )
    }

    // Line 2
    for i in 0..<8 {
        let value = Double.random(in: 5...20)
        temp.append(
            LineChartData(
                date: sampleDate.adding(.month, value: i)!,
                value: value,
                type: .optimal
            )
        )
    }

    return temp
}()


#Preview {
    VStack {
        Spacer()
        LineChartView(data: chartData)
            .padding()
        Spacer()
    }
}

extension Date {
    func adding (_ component: Calendar.Component, value: Int, using calendar: Calendar = .current) -> Date? {
        return calendar.date(byAdding: component, value: value, to: self)
    }

    var startOfDay: Date {
        return Calendar.current.startOfDay(for: self)
    }
}
Comments
Loading comments…